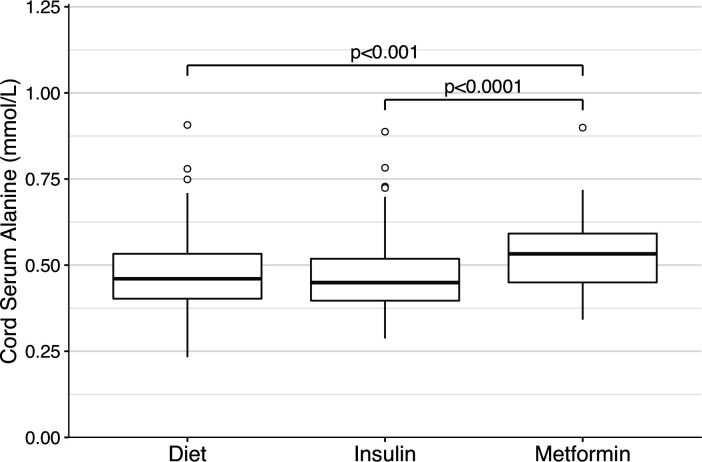
Figure 1.
Cord serum alanine concentrations in the diet-treated, insulin-treated, and metformin-treated groups. Boxplot representation of the distributions of cord serum alanine concentrations in the diet-treated, insulin-treated and metformin-treated groups, respectively. IQRs with medians are marked with boxes, and the whiskers denote the range. Outliers, which were defined as being more than 1.5 times the IQR away from the median, are marked with circles. P values are given for differences in the Dwass-Steele test and only significant values are shown.

