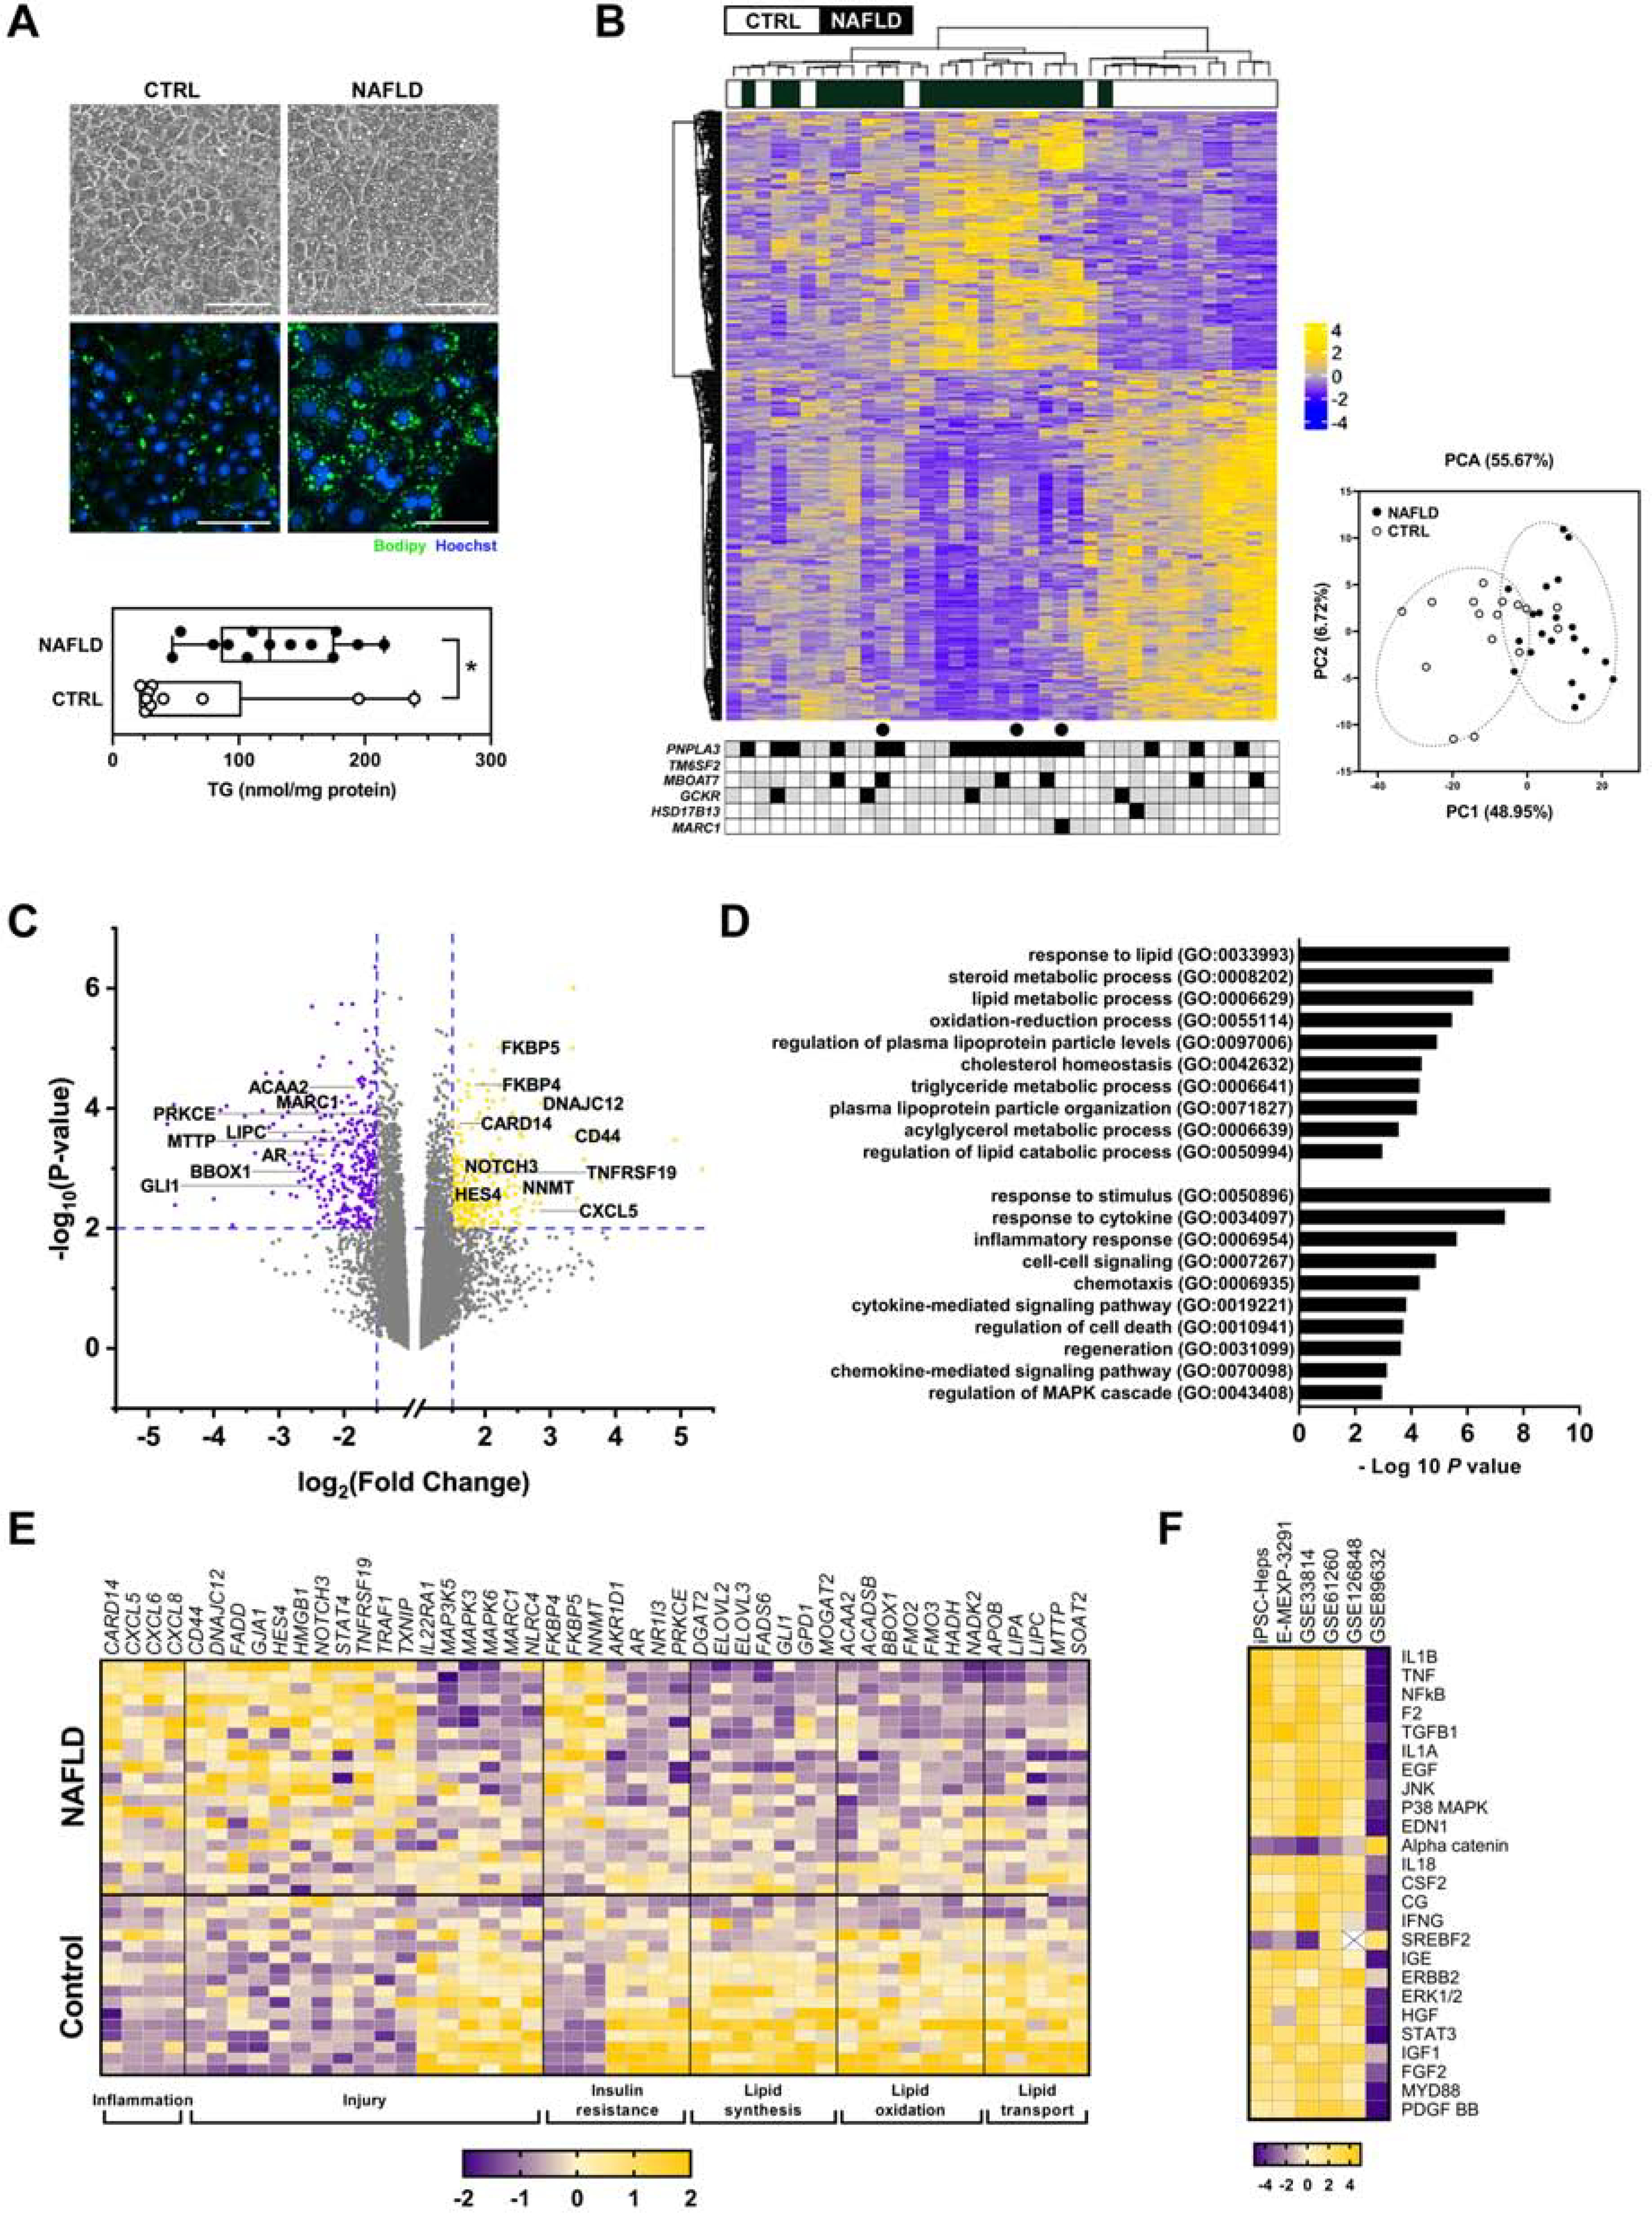
Figure 1. Comparison of iPSC-Heps from NAFLD and control subjects.

(A) Photomicrographs illustrate control and NAFLD iPSC-Heps on day 22 of differentiation. Panels depict phase contrast morphology and fluorescent images documenting lipid content (Bodipy 493/503). Graph demonstrates the triglyceride content of iPSC-Heps at day 22. * P < 0.05. (B) Heatmap illustrates unsupervised clustering of RNA sequencing data and the accompanying principal component analysis from control and NAFLD iPSC-Heps (367 genes, |FC| > 1.5, FDR < 0.05). Beneath the heatmap is the SNP genotyping profile of each subject for PNPLA3 (rs738409), TM6SF2 (rs58542926), MBOAT7 (rs641738), GCKR (rs780094), HSD17B13 (rs72613567) and MARC1 (rs2642438). Black = homozygous for risk or protective allele; gray = heterozygous; white = no risk or protective allele. ● denotes subjects with histologic hepatic steatosis but not NASH. (C) Volcano plot illustrates 235 upregulated and 331 downregulated genes in NAFLD iPSC-Heps vs. controls (|FC| > 1.5, P < 0.01). Select genes are noted by name. (D) Histogram illustrates select Gene Ontology biological processes that were significantly dysregulated in NAFLD vs. control iPSC-Heps (|FC| > 1.5, FDR < 0.25). (E) Heatmap illustrates differential regulation of select candidate genes in NAFLD vs. control iPSC-Heps, organized by function. (F) Heatmap demonstrates the top 25 differentially expressed upstream regulators in NAFLD vs. control iPSC-Heps, compared to data from 5 publicly available datasets of liver tissue from humans with NAFLD as noted by accession number (via Ingenuity Pathway Analysis; see Methods).
