
Figure 4.
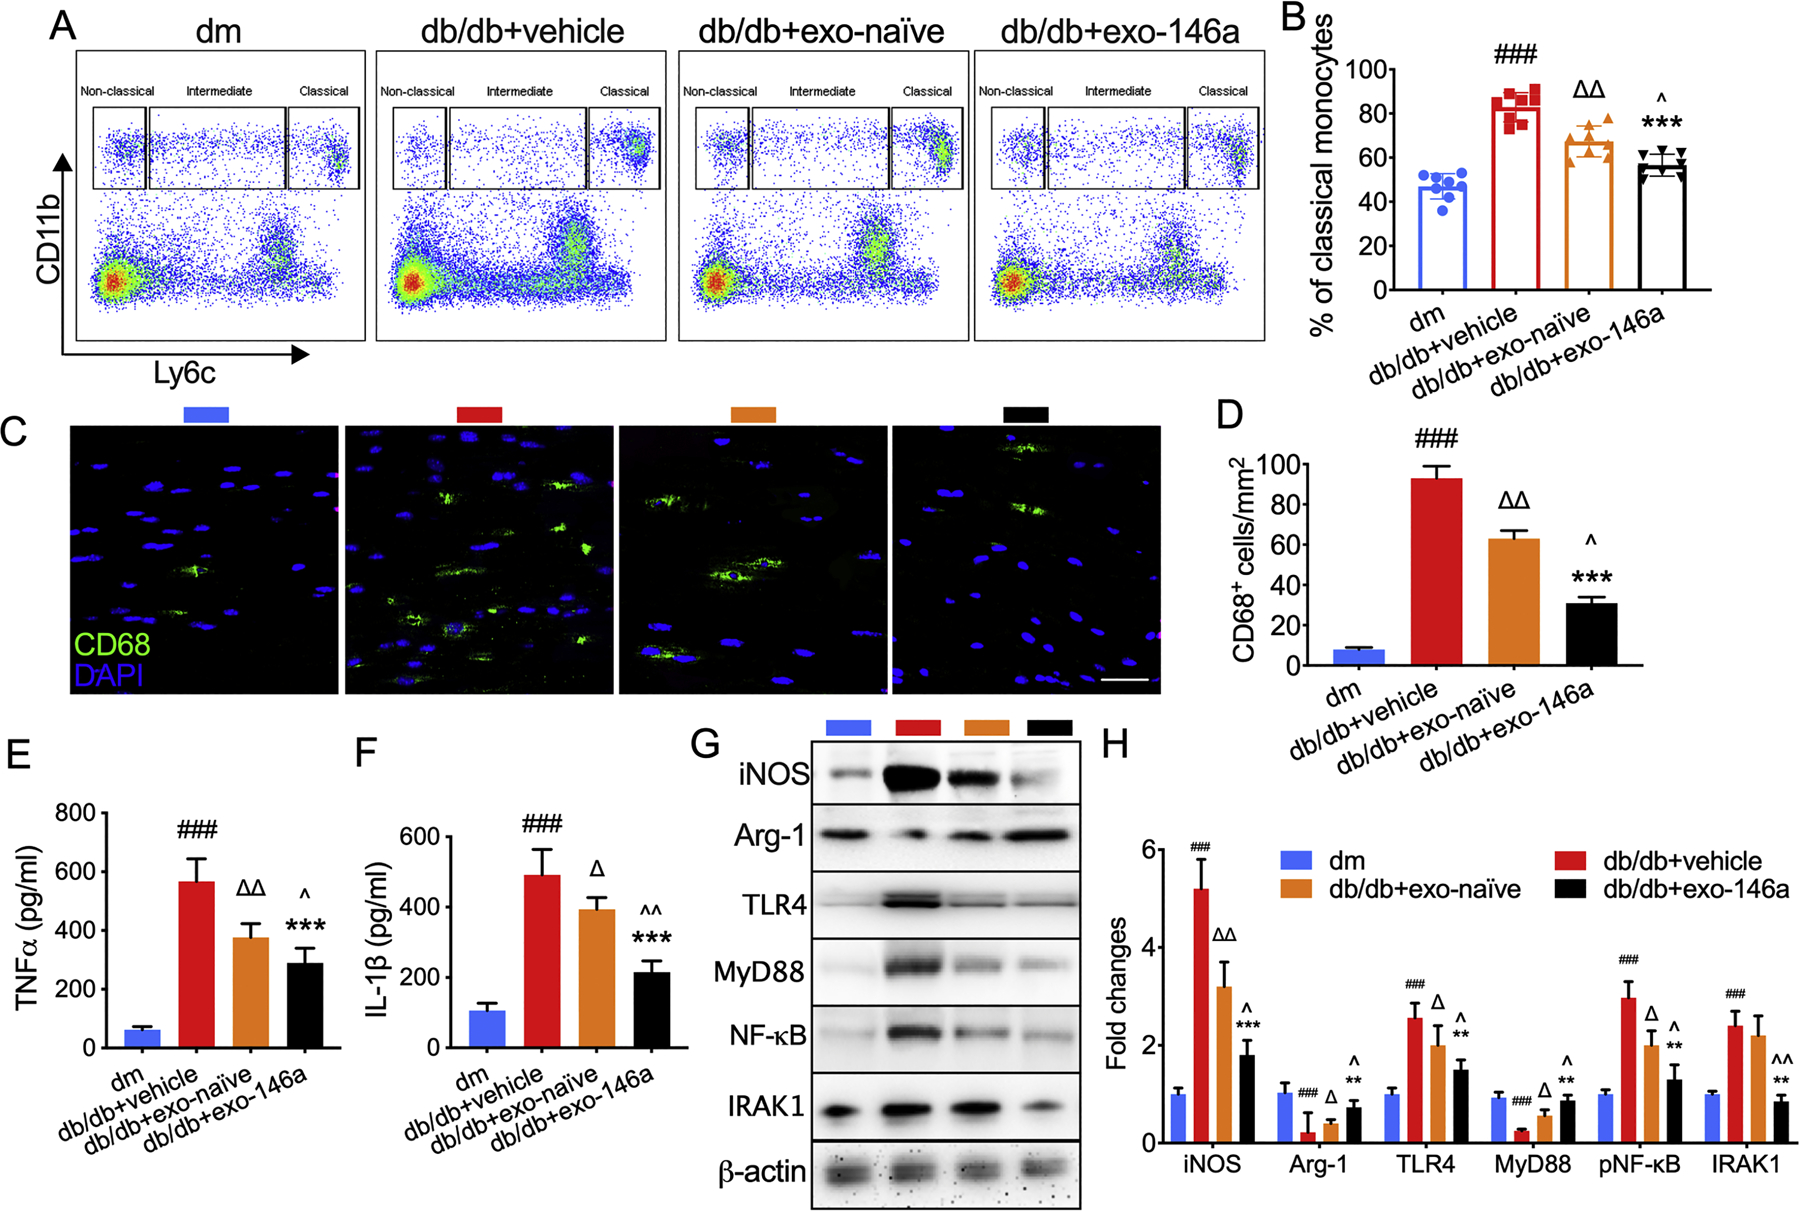
Effects of exo-146a treatment on inflammatory response. A-B: Monocyte subsets in the blood were characterized by CD11b and Ly6C staining. A: Representative pattern plot of monocyte subsets in the peripheral blood of mice. B: Quantification of monocyte subsets. N = 8/group. C-D: Representative immunofluorescent images and quantitative data of active macrophages (CD68+ cells) in sciatic nerve. E-F: Exo-naïve and exo-146a inhibited the secretion of TNFα and IL-1β in the supernatant from intraperitoneal macrophages cultures tested using ELISA. G-H: Representative images of Western blot analysis and the relative expression levels of iNOS, Arg-1, TLR4, MyD88, and NF-κB in macrophages. N=3/group. ###p<0.001 db/db+vehicle vs dm; ∆p<0.05, ∆∆ p<0.01 db/db+vehicle vs db/db+exo-naïve; **p<0.01, ***p<0.001 db/db+vehicle vs db/db+exo-146a; ^p<0.05, ^^p<0.01 db/db+exo-naïve vs db/db+exo-146a.