
Figure 10.
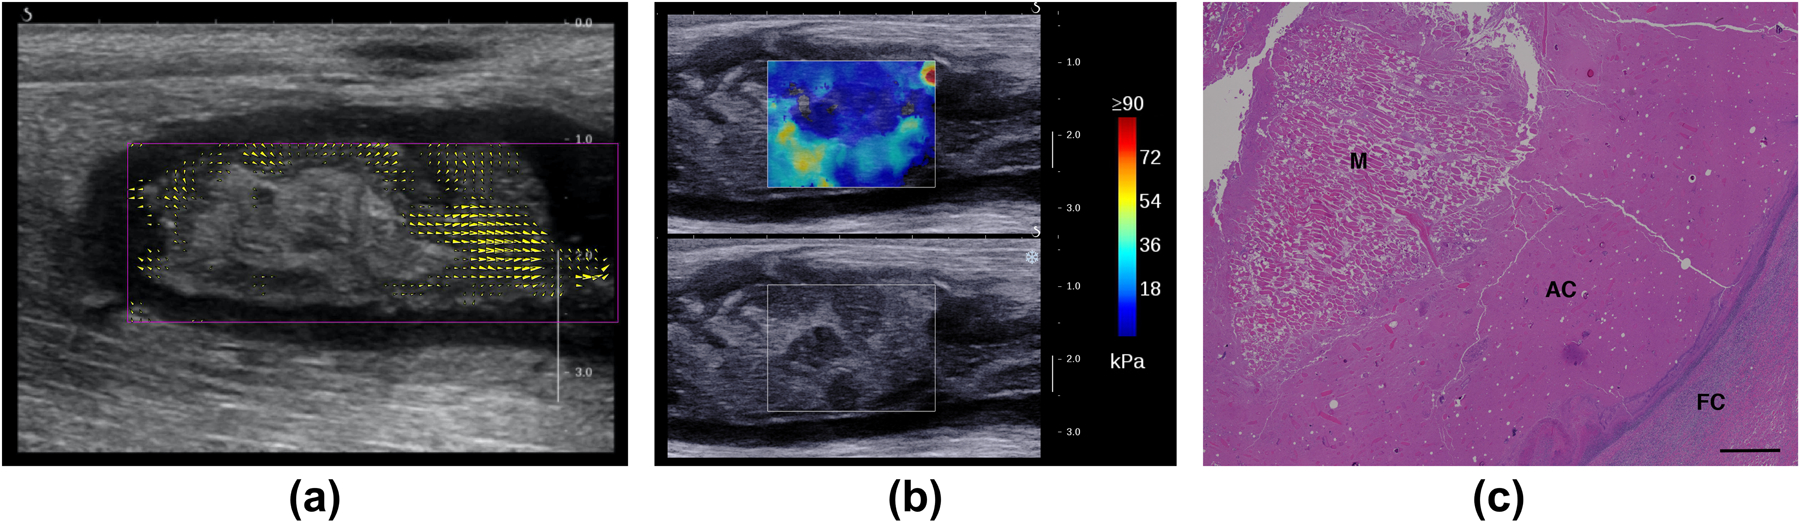
Internal flow with compression and core heterogeneity for the intramuscular abscess case ABS2. (a) Regions of flow with external compression are identified and quantified by comparing regional frame-to-frame displacements at week 3 post-injection. The yellow arrowheads show the direction and magnitude of the displacements. The largest arrows correspond to 1 mm displacements; arrows with magnitudes less than 0.35 mm are not shown. (b) Long-axis SWE image shows regions of varying stiffness in the core at week 3 post-injection. The region with higher stiffness corresponds to the stationary region in (a). (c) Histology of the abscess core with Hematoxylin and Eosin at week 4 post-injection shows a block of muscular tissue (M) within the abscess core (AC). FC: Fibrous Capsule. Scale bar: 1000 microns.