
Figure 6.
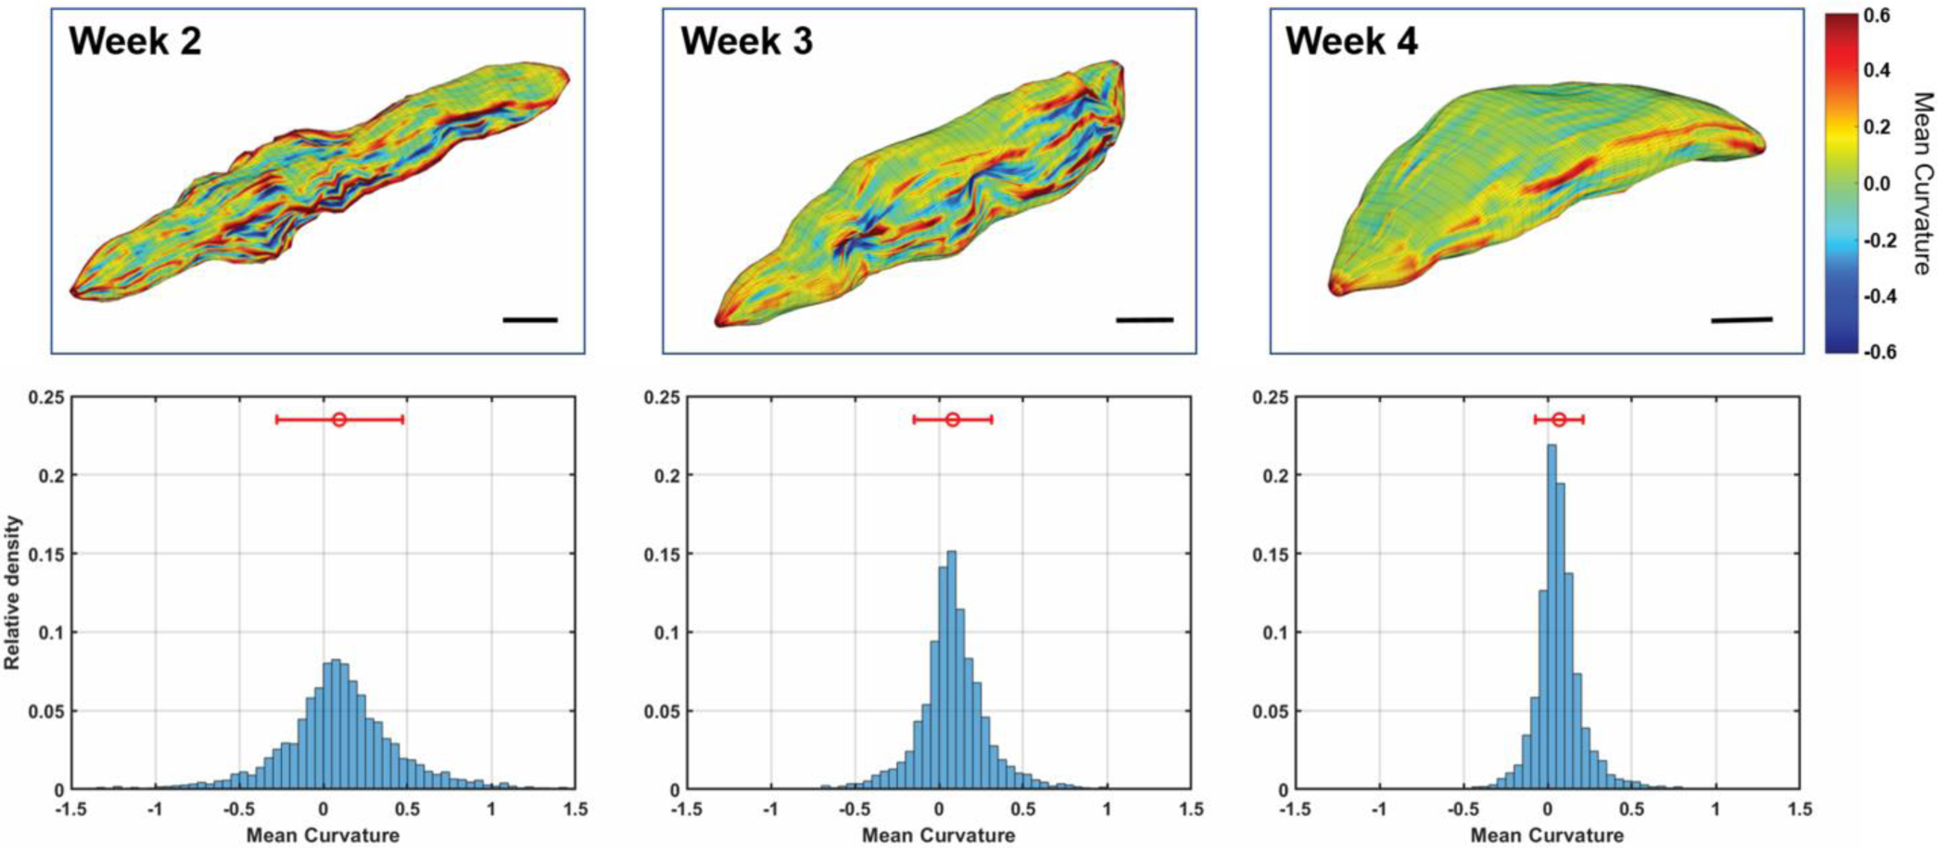
Core surface curvature over time for case ABS2 at weeks 2 through 4 post-injection. Top row: Mean curvature mapped to the surface reconstruction according to the color scale at the right. Scale bars: 1 cm. Bottom row: Histograms of the mean curvature measurements, with the mean and standard deviation shown above. Each histogram is normalized so that the bins sum to one. The curvature measurements of the core surface over time demonstrate a change from an irregular border to a rounded and more well-defined border. Circle: Mean. Bars: Standard deviation. Number of vertices compiled for each histogram: 4558 Week 2, 5144 Week 3, 4622 Week 4.