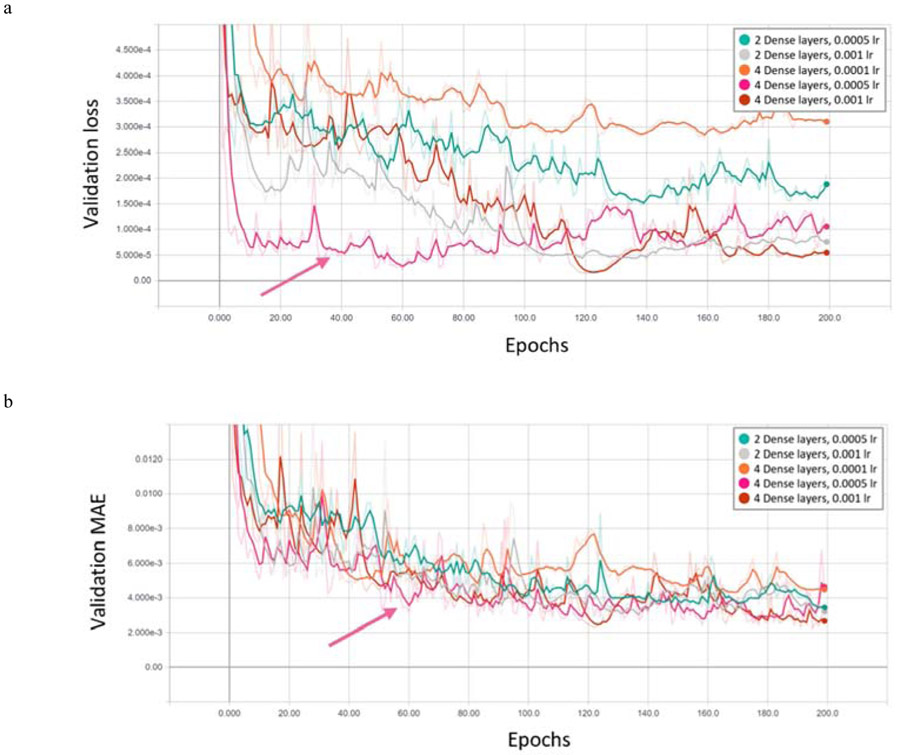
Figure 4 –
Examples of validation loss (a) and MAE (b) for second round of evaluations, where the combinations were reduced to 3 convolutional layers; 3 and 4 dense layers; 32 nodes per layer (convolutional and dense); 0.001, 0.0005 and 0.0001 learning rates. The lower the values of validation loss and MAE indicated a better model. From these plots 3 convolutional layers, 4 dense layers with 32 nodes and a 0.0005 learning rate were chosen for elasticity regression of F/N = 1 (pink arrow). The curves are plotted using Tensorboard with a smoothing factor of 0.5 (solid color lines) over the calculated values (shaded color lines).

