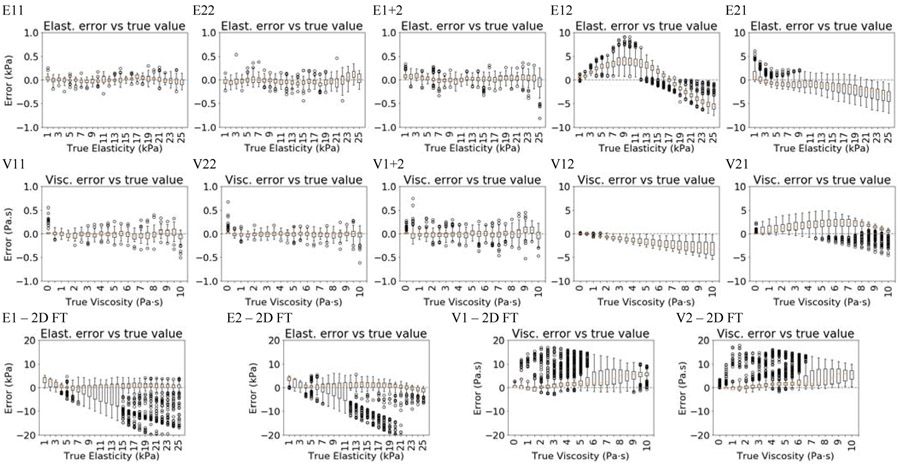
Figure 5 –
Elasticity and viscosity error box plots aggregated by true values, the top ten plots are results for the CNNs trained, validated and tested on data from the same and different F/N datasets, whereas the bottom four were evaluated using Fourier analysis (FT) for comparison. The letter designates what label was used, elasticity (E) or viscosity (V); the first number specifies the F/N used for training and validation, whereas the second number designates the F/N used for testing.

