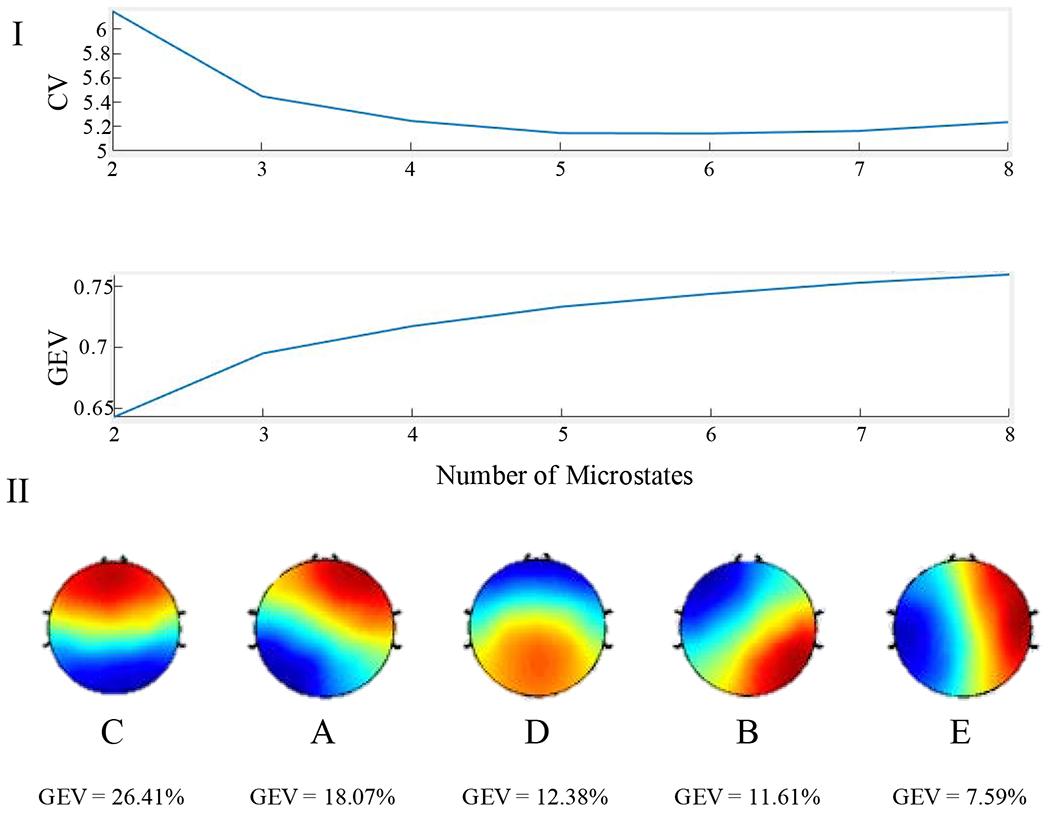
Figure 2:

I: Selecting an active number of microstates for record segmentation. Top: Graph of the Cross Validation Criterion across active microstates. In order to determine the best fitting number of microstates, the CV should be minimized. Bottom: Graph of the Global Explained Variance across active microstates. Although a larger number of active microstates would explain more global variance, adding additional microstates can lead to over-fitting the data. II: Microstate topographies in descending order of GEV. These maps correspond to the 4 canonical microstates in the order of C, A, D, B. The final microstate map (“E”) is a common additional map.
