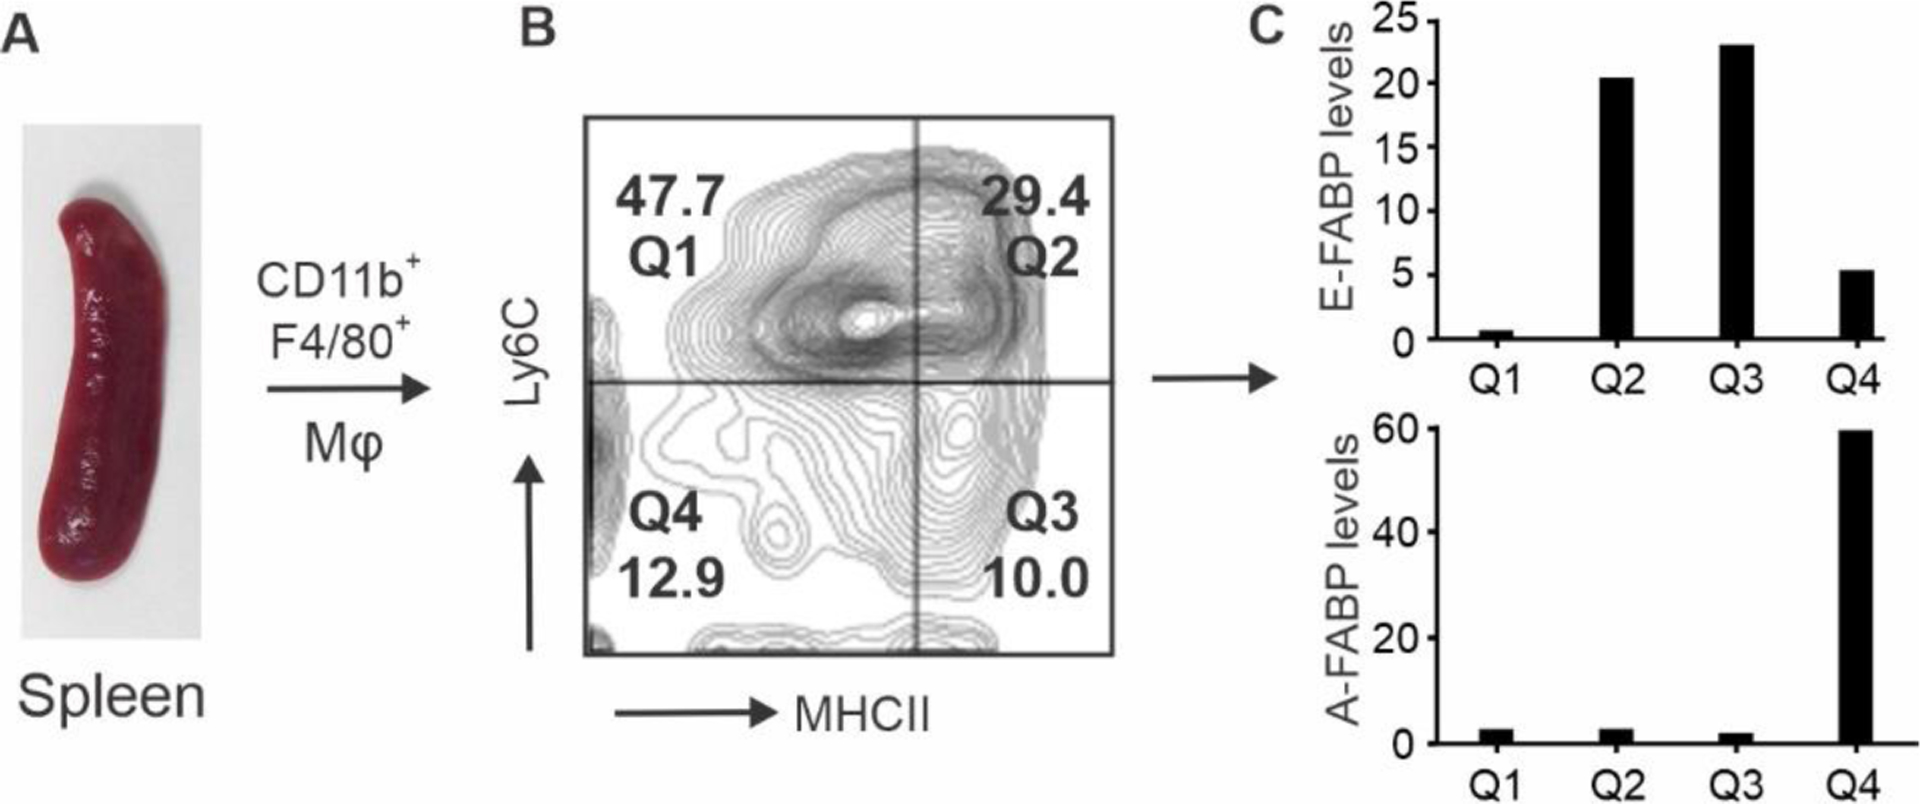
Figure 1. A-FABP and E-FABP expression pattern in splenic macrophages.

Splenic macrophages (CD11b+F4/80+) (A) are divided into four subsets (Q1-Q4) by the surface markers Ly6C and MHCII (B). Individual subsets were separated by a flow sorter and relative levels of A-FABP and E-FABP in each subset were assessed by real-time PCR (C).
