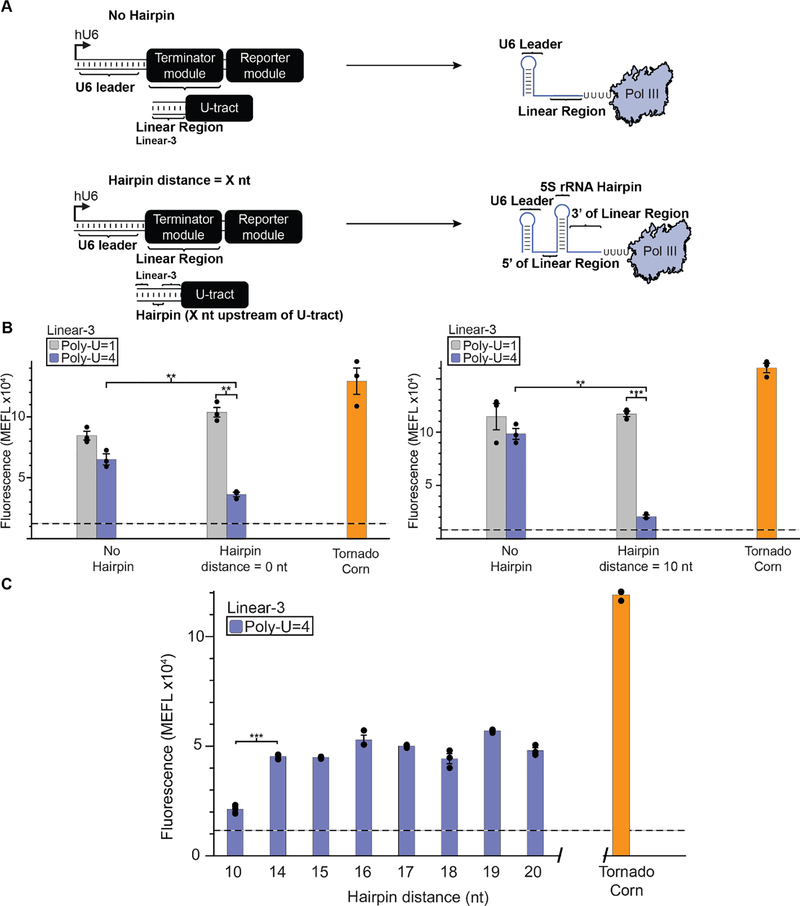
Figure 4: Distance of RNA structure from the poly-U tract impacts termination efficiency.
A) A schematic depicting the positioning of predicted secondary structure upstream of the poly-U tract. This structure was either omitted (No Hairpin) or positioned X nt upstream of the poly-U tract (where Hairpin distance = X nt). The secondary structure utilized is a 23 nt portion of the 5S ribosomal RNA (rRNA) predicted to fold into a 9 bp hairpin. In these constructs, the Linear-3 sequence was used to enable X to be up to 20 nt. B) Constructs based upon Linear-3 exhibit a pattern which is similar to those based upon Linear-1 and −2 for hairpin distances of 0 or 10 nt. Significance was measured using a one-tailed heteroscedastic Welch’s t-test followed by the Benjamini-Hochberg procedure with a false discovery rate cutoff of 0.05 (Supplementary Table 2). ** = p < 0.01, *** = p < 0.001. C) Moving the hairpin further upstream from the poly-U tract reduces termination efficiency. Observed fluorescence for hairpin distances 10, differed significantly from those with a hairpin distance of 14, 15, 16, 17, 18, 19 and 20 (Supplementary Table 4). Colored bars represent the average of 3 biological replicates with individual points plotted as circles. Error bars represent the S.E.M. The dashed line represents the average of three replicates for the vector-only control (v) and the grey horizontal bar represents the S.E.M. of the vector-only control.

