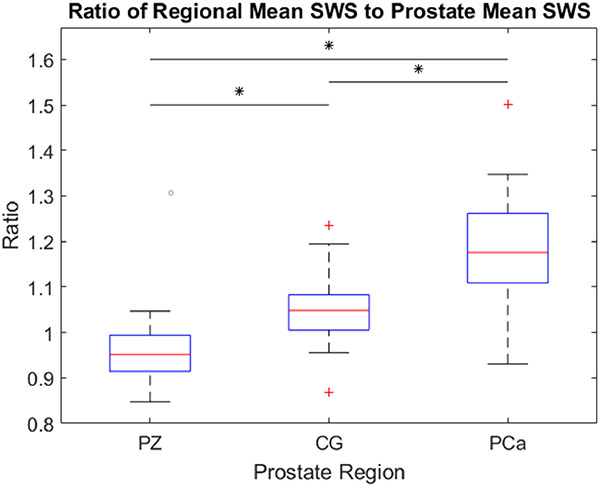
Figure 4:
Boxplots representing the ratio of the regional mean SWS to the entire prostate mean SWS versus the prostate region (PZ – peripheral zone; CG – central gland; PCa – segmented prostate cancer). Each column contains data from 36 patients. Statistically significant differences (p<0.0001) are indicated by asterisks (*).

