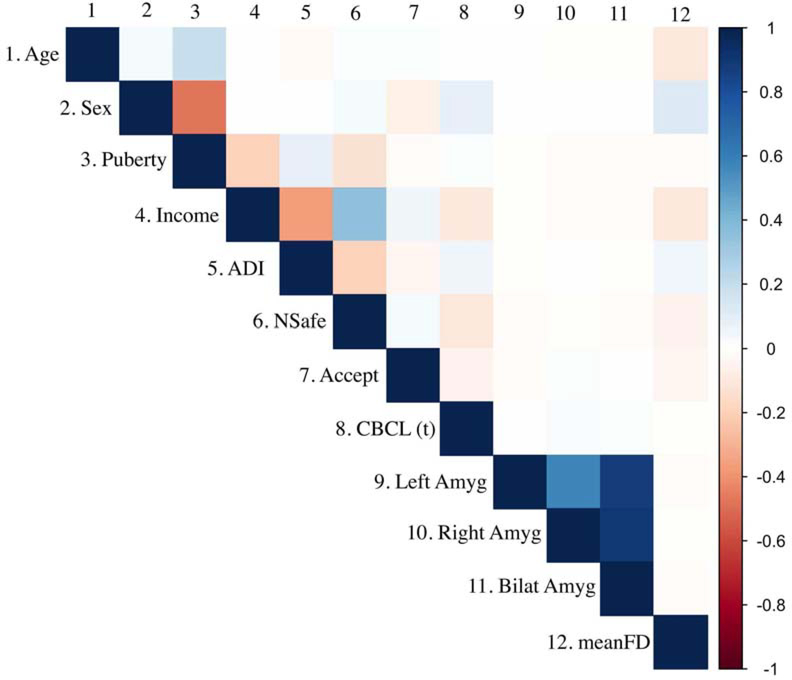
Figure 2.
Correlation table Showing the direction and magnitude of effects between key study variables. Positive correlations are shown in blue; negative correlations are shown in red. The associated magnitude is represented by the color in the colorbar.
ADI = Area Deprivation Index; NSafe = Parental Report Neighborhood Safety; Accept = Parental Acceptance; Bilat Amyg = Bilateral Amygdala; meanFD = Mean Framewise Displacement during EN-back. Sex: Male = 1, Female = 0. CBCL(t) = Internalizing Symptoms

