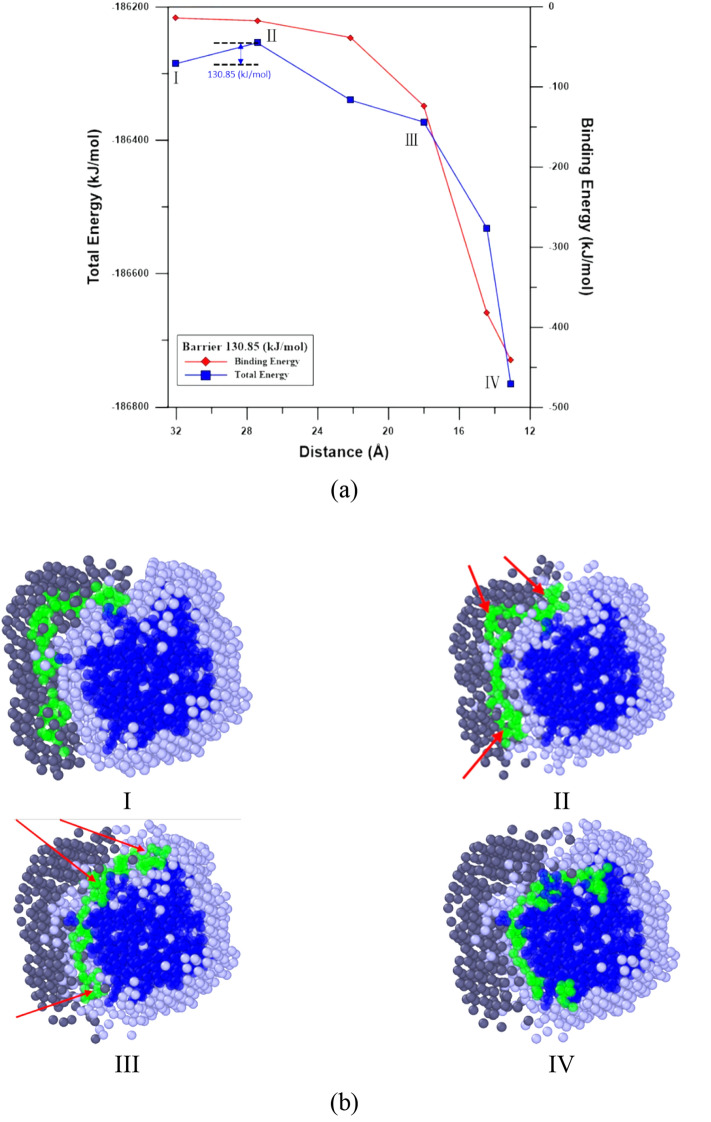
Figure 6.
(a) Total energy and binding energy profiles with the center-of-mass distance between AptEpA and EpCAM for CG_Case1 during the NEB process. (b) The slice plane views of water bead distribution within 10 Å from AptEpA. Morphologies I to IV correspond to structures as labelled in the NEB profile. The AptEpA, EpCAM, water beads surrounding AptEpA and water beads surrounding EpCAM are marked in green, dark blue, dark gray, and light gray, respectively.

