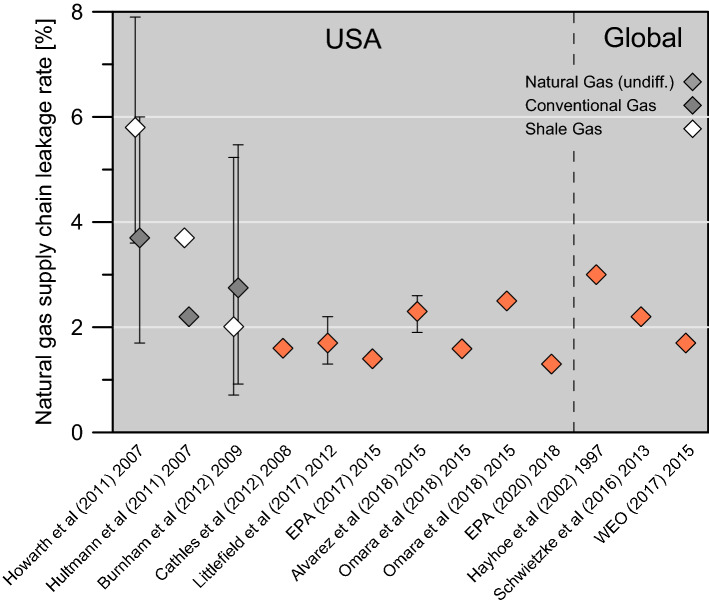
Figure 3.
Literature compilation of methane leakage rate assessments with U.S. national and global scope, chronologically ordered. If reported, emissions are differentiated for conventional or shale gas and error bars are given (detailed listing see Supplementary Table S3). Next to the publication year the dataset year is given. Omara et al.15 report exclusively on production losses—thus, for comparison, downstream emissions of 1%14) were added.

