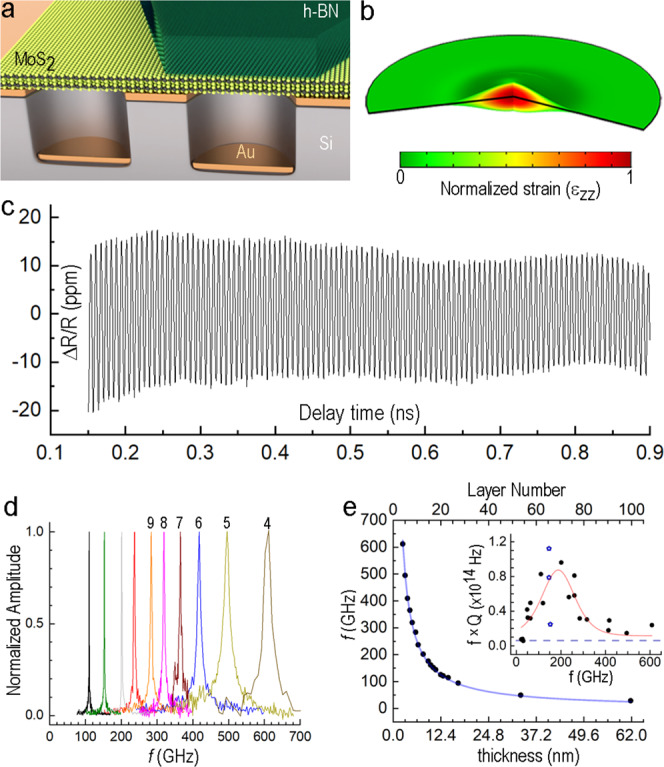
Fig. 1. Mechanical response of acoustic cavities implemented as suspended 2D films.

a Schematic showing MoS2 and MoS2/h-BN films on a Ti/Au-coated substrate with pre-etched circular wells. b Snapshot of the normalized εZZ mechanical strain (color coded) in the vibrating part of the MoS2 suspended plate as predicted by time-dependent FEM analysis. The pump beam is modeled as Gaussian with radius 0.5 μm. The part of the plate included in the model is limited by the radius 2 μm with low-reflecting outer boundaries. c Time-dependent reflectivity of a suspended MoS2 film, shown for delay time between 0.15 and 0.9 ns in parts per million (ppm). d Examples of normalized FFT spectra of the time-dependent reflectivity taken from different MoS2 cavities. The high frequency peaks are labeled with the corresponding MoS2 film thicknesses in layer number as extracted from Raman spectroscopy data (see frequency vs. layer number dependence in Supplementary Fig. 2). The peaks are displayed in different colors to help readability. e Frequency versus layer number for a range of MoS2 acoustic cavities. (inset) f × Q of MoS2 cavities as a function of frequency. The dashed line shows the value required for ground state cooling (6 × 10¹² Hz). The red curve is added as a guide-to-the-eye and was obtained as a fit using a logistic distribution. Variability in f × Q values for different cavities in the vicinity of 150 GHz is illustrated by the blue star points with f × Qaverage = 0.7 × 10¹⁴.
