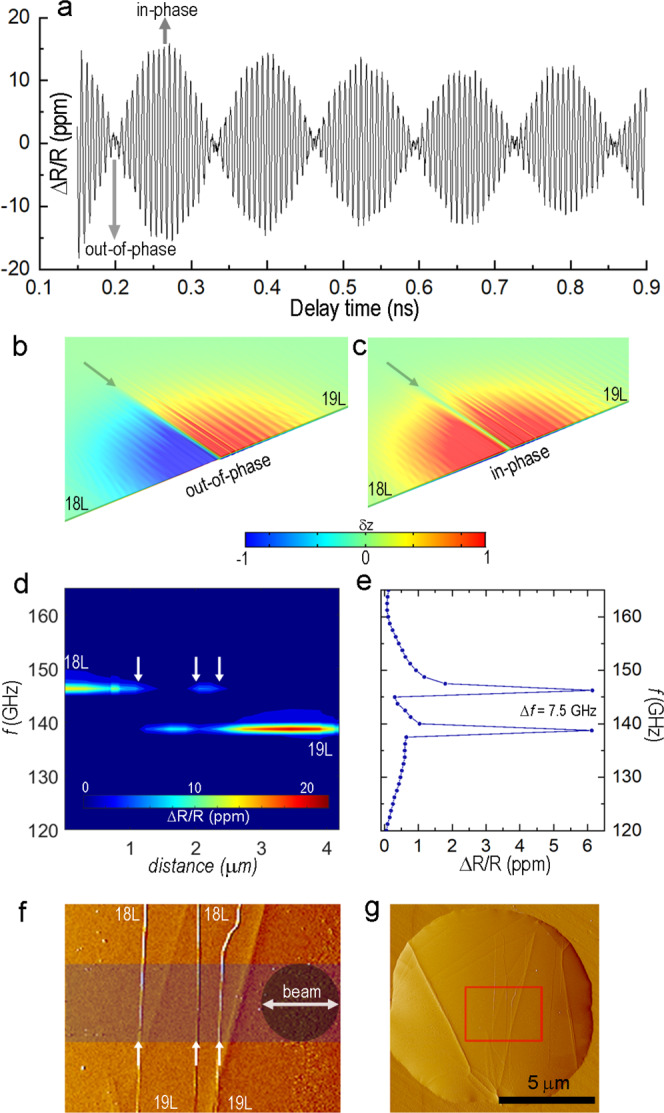
Fig. 2. Horizontally-abutted cavities divided and detuned by a monolayer step.

a Time-dependent reflectivity taken at a monolayer step boundary on an 18-layer (18 L)/19-layer (19 L) MoS2 suspended film. The in-phase and out-of-phase labels show the timing for the snap-shots in b, c. FEM-generated snapshots of normalized vertical displacement maps (δz) highlighting the out-of-phase (b) and in-phase (c) vibrations of the abutted cavities at the monolayer step. Additional information for the time-domain FEM analysis are included in the Supplementary Information (Supplementary Note 2 and Supplementary Movie 1). d 2D plot showing color-coded FFT spectra of the probe reflectivity acquired at different positions while stepping the beam across the monolayer steps shown in f. e FFT spectrum of time-dependent reflectivity from a, which is taken approximately at the 2.2 μm position in d. f AFM phase-image showing the region where the spectra in a and d were acquired. The monolayer steps run vertically across the image. The horizontal darkened band shows the path where the 1 μm diameter beam was scanned across the surface. g Low magnification AFM phase-image showing the MoS2 drum (see Supplementary Fig. 4 for optical image). The red box highlights the region imaged in f.
