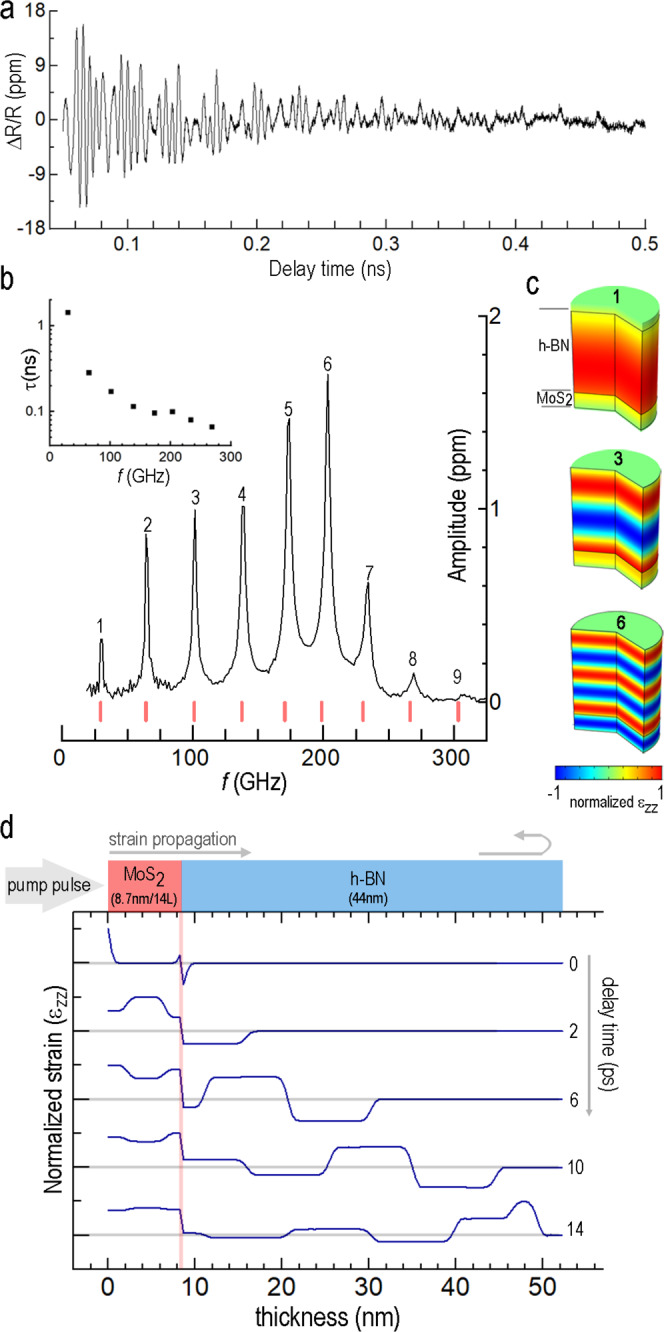
Fig. 3. Frequency comb generator implemented in a h-BN/MoS2 bilayer.

a Time-dependent reflectivity for a h-BN (44 nm)/MoS2 (8.7 nm/14 L) suspended film. b FFT spectrum of the signal shown in a. The red tick marks along the bottom of the plot show positions of the bilayer overtones as predicted by FEM eigenfrequency analysis. The peaks are numerically labeled from lowest to highest frequency. (inset) Extracted lifetimes for h-BN (τhBN) versus frequency for peaks in b (see Supplementary Note 4 for details of the extraction method). c Spatial configuration of the normalized εZZ strain for three different modes (labeled) in the h-BN/MoS2 heterostructure (eigenfrequency FEM analysis, 1D model). d Snapshots of the εZZ strain distribution generated by optically-excited MoS2 are shown across the thickness of the bilayer at early delay times (for details of time-domain axisymmetric FEM analysis, see Supplementary Note 3).
