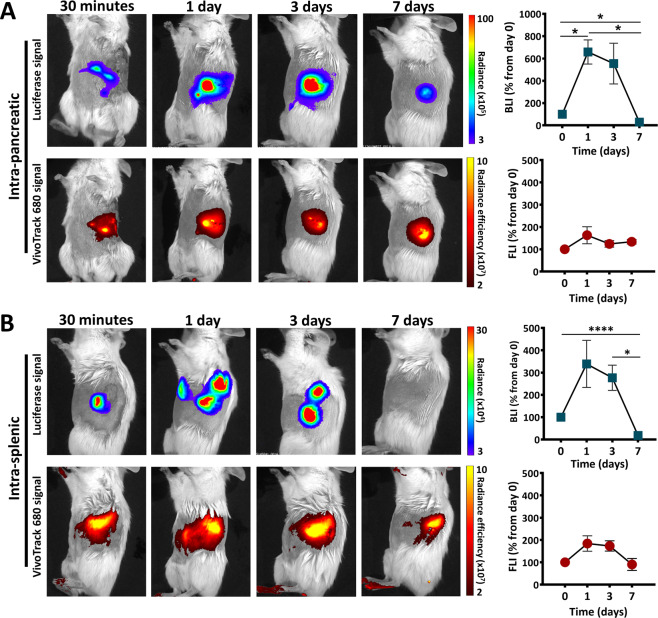
Fig. 2. Biodistribution of MSC after intrapancreatic or intrasplenic transplantation in pre-diabetic NOD females.
BLI and FLI time-course images of a representative mouse transplanted with Luc+ VT680+ MSC into the pancreas (A) and spleen (B). The diagrams on the right illustrate the quantitative data from all mice within each group (n = 5–6 per group). Data are plotted as mean ± SEM (*p < 0.05, one-way ANOVA followed by Tukey’s test).

