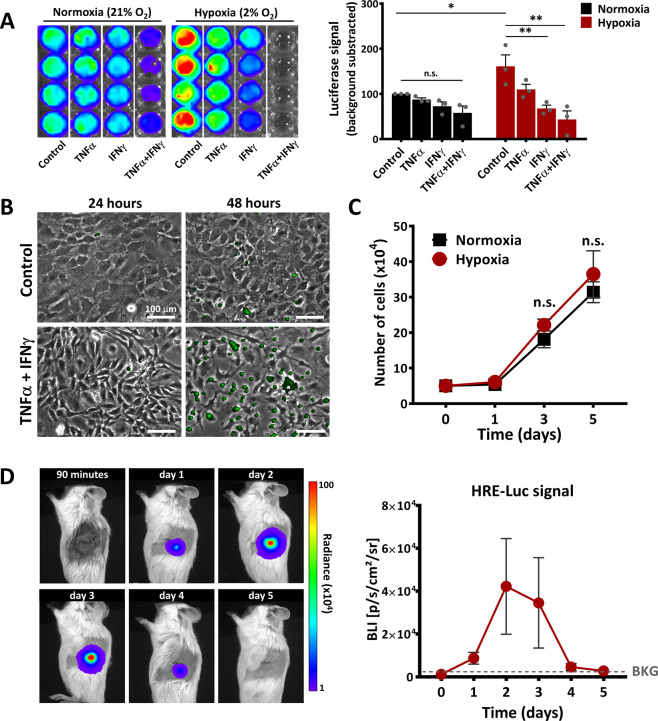
Fig. 3. The behaviour of MSC in hypoxic environment.
A The increase in Luc expression under the PGK promoter in Luc+ MSC, following in vitro exposure for 24 h to hypoxia and/or the pro-inflammatory cytokines TNFα and IFNγ. Data are plotted as mean ± SEM from four biological replicates (*p < 0.05, two-way ANOVA followed by Tukey’s test). B Phase-contrast microscopy illustrating the apoptosis activation in MSC cultured under hypoxic conditions (2%O2) in the absence (Control) or presence of inflammatory cytokines (TNFα + IFNγ). Apoptosis was detected by time-lapse fluorescence microscopy using CellEvent™ Caspase-3/7 reagent. Note that the cells are not affected by hypoxia per se, yet the presence of pro-inflammatory cytokines induced a massive rate of apoptosis after 48 h in vitro. C The proliferation curve of MSC under normoxia and hypoxia conditions within a 5-day interval. Note the minor and not-significant increase in MSC number under hypoxic conditions, as compared to normoxic conditions. D The time-course images of BLI signal produced by HRE-Luc-MSC after intra-pancreatic transplantation in a NOD mouse. The BLI signal denotes the local activation of hypoxia. The quantitative data from five mice is given on the right side. Data are plotted as mean ± SEM. Note the high increase in the BLI signal at days 2 and 3. However, due to the large variability in the animal responses, the increases were not statistically significant (one-way ANOVA followed by Tukey’s test).

