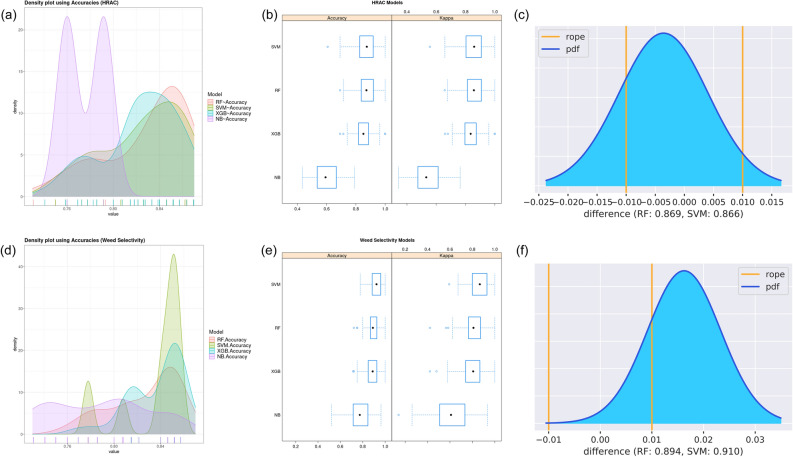
Figure 1.
Comparing performance of the four ML classifiers for MoA predictions. (a, d) Density accuracy plot. (b, e) Box plots of distributions of resampled accuracies and kappa values. (c, f) Probability density plot for accuracy differences between the RF and SVM classifiers. The plots (a)–(c) described MoA classifiers (Table 2) and those (d)–(f) present comparison of weed selectivity models built with nine descriptors including log P (Table 3). The RF and SVM MoA classifiers are largely equivalent since 75.7% of posterior probability distribution is inside the region of practical equivalence (rope, the differences of accuracy are less than 1%).

