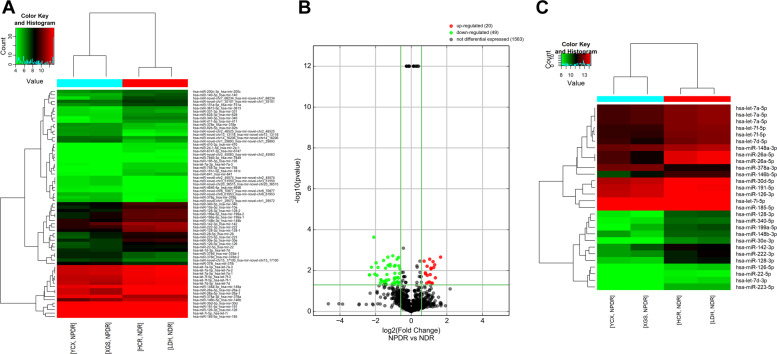
Fig. 2. Plasma miRNA profiles of NPDR and NDR subjects.
A A heatmap shows the miRNAs with >1.5 fold changes in expression. The miRNAs are hierarchically clustered on the y-axis based on their expression. B A volcano plot showing RNA sequencing results for the comparison of mild NPDR and NDR patients. The line indicates a false discovery rate (FDR)–adjusted P-value of 0.05. Individual microRNAs are displayed by their FDR-adjusted P-value. The up-regulated miRNAs are shown in red, while the down-regulated miRNAs are in green. C A heatmap shows the 28 differential miRNAs that are reported to be related to the development of DR. The expression index is colour-coded with green indicating down-regulation and red indicating up-regulation.

