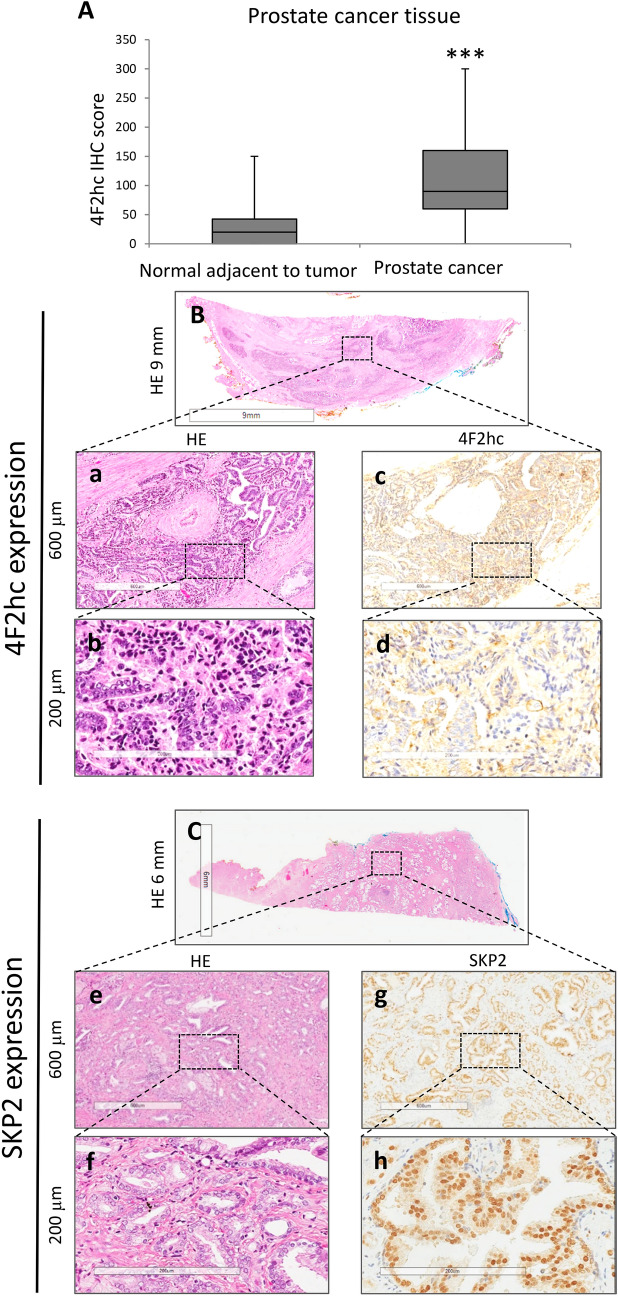
Figure 5.
Representative staining pictures showing 4F2hc and SKP2 expression in PC tissues. Quantification of 4F2hc staining of NAT and PC tissues. The 4F2hc IHC scores levels are shown in normal prostate tissues and PC (A). 4F2hc and SKP2 expression in PC tissues was analysed by immunohistochemistry. Sections were stained with haematoxylin and eosin (B; a: 600 µm and b: 200 µm and C; e: 600 µm and f: 200 µm). Representative images of 4F2hc immunohistochemical expression (c: 600 µm and d: 200 µm) and representative images of SKP2 immunohistochemical expression (g: 600 µm and h: 200 µm). Representative staining images are shown.

