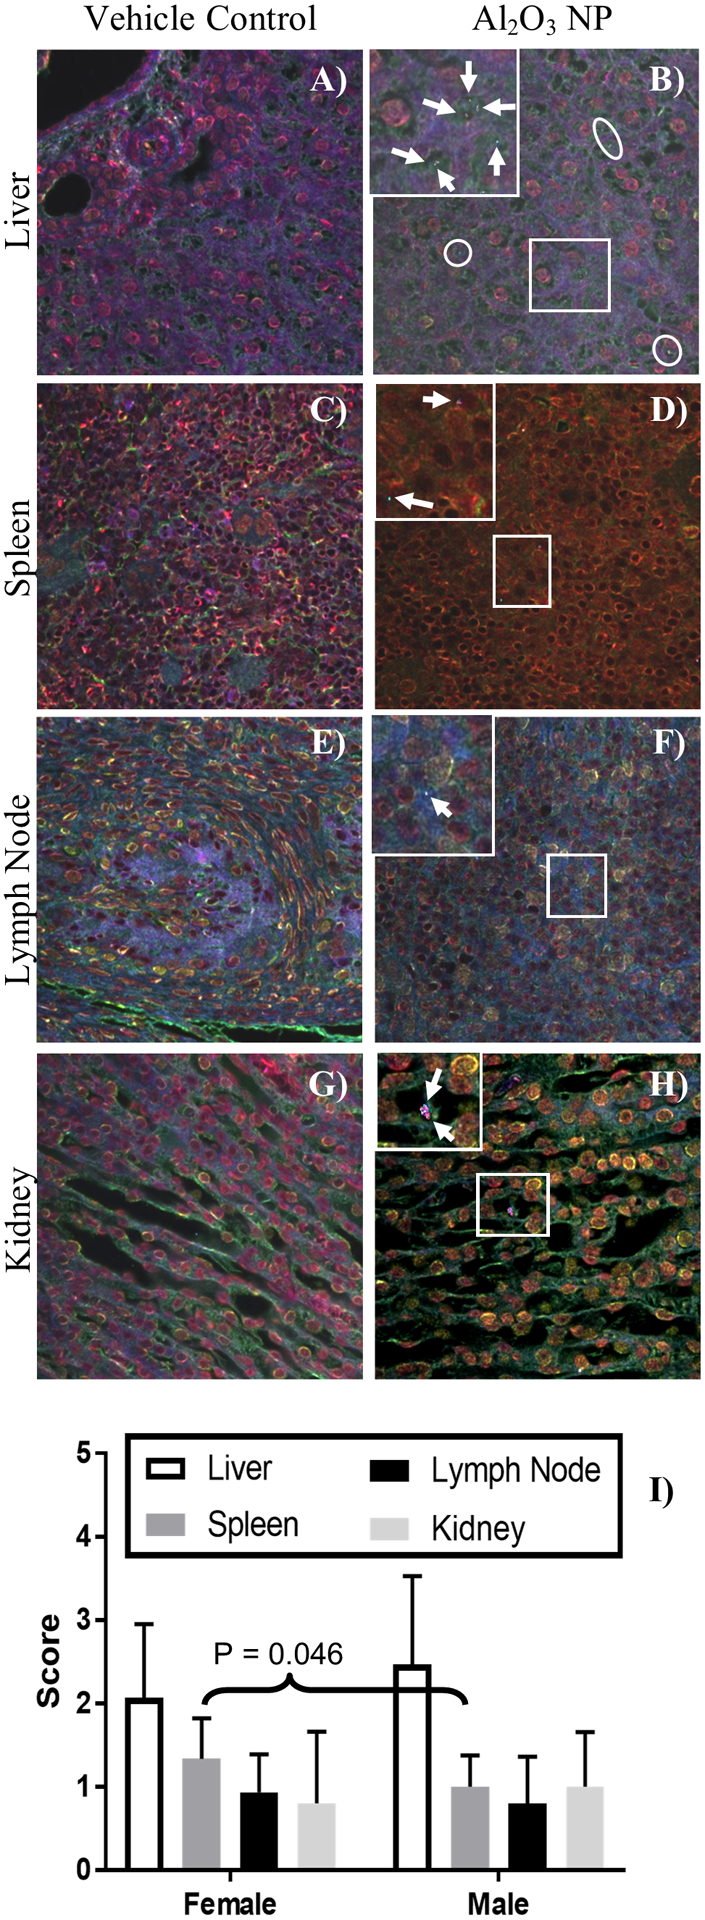
Figure 6.

Hyperspectral images of H&E stained vehicle control and Al2O3 NP dosed A-B) liver, C-D) spleen, E-F) lymph node, and G-H) kidney. Mapped areas are highlighted in the HSI images and indicated by circles. A magnification outlined with a white square is inserted for each of the Al2O3 NP tissues to show the cellular location of NPs and the mapped areas are shown with white arrows. A, C, D, E, G, H) are male tissues and B, F) are female tissues, no visible differences were observed between male and female tissues. The presence of Al2O3 NP was scored in the tissues: 0 = no NP signals detected; 1 = 1 – 10 NP signals detected; 2 = 11 – 25 NP signals detected; 3 = 26 – 50 NP signals detected; 4 = 51 – 100 NP signals detected; 5 = >100 NP signals detected. The score for Al2O3 NP was highest in the liver compare to spleen, lymph nodes, and kidney, showing mean ± standard deviation
