
Fig. 2.
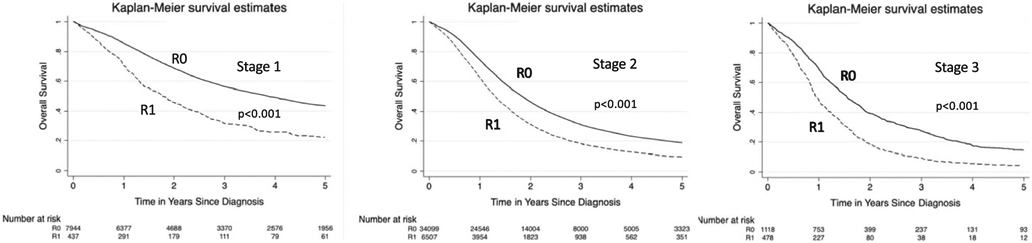
Kaplan–Meier survival graphs by stage. Kaplan–Meier curves demonstrating 5-year survival for pancreatic adenocarcinoma comparing patients with R0 vs R1 resection margin at every stage
Official websites use .gov
A
.gov website belongs to an official
government organization in the United States.
Secure .gov websites use HTTPS
A lock (
) or https:// means you've safely
connected to the .gov website. Share sensitive
information only on official, secure websites.
Kaplan–Meier survival graphs by stage. Kaplan–Meier curves demonstrating 5-year survival for pancreatic adenocarcinoma comparing patients with R0 vs R1 resection margin at every stage