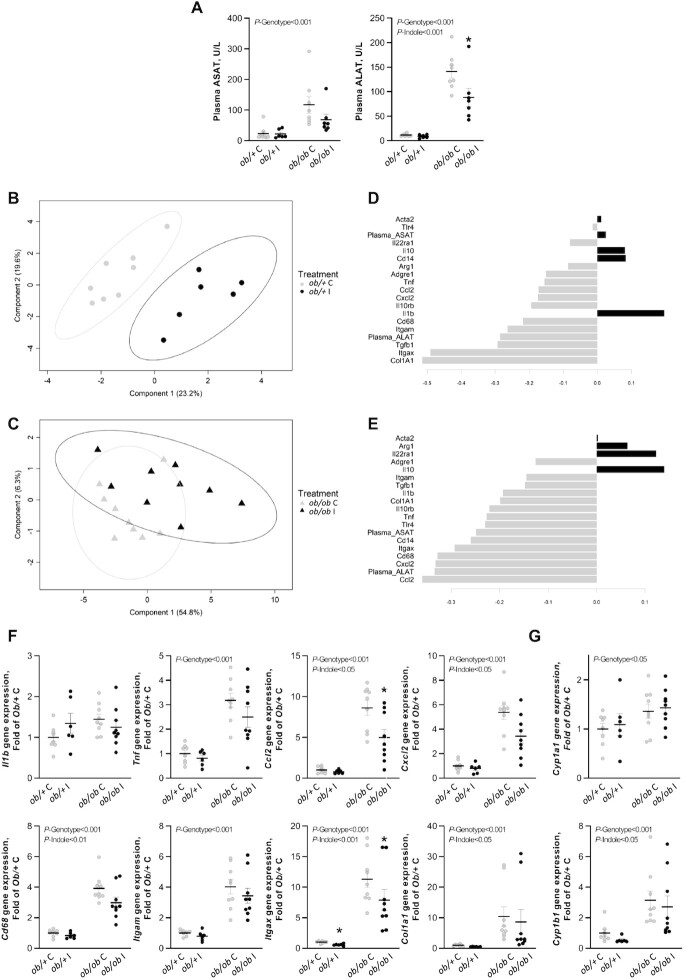
FIGURE 2.
Effect of indole on (A) serum amino transferases and (B–G) hepatic gene expression in ob/+ and ob/ob mice in experiment 1. PLS-DA analysis was performed on hepatic inflammatory and immune parameters in (B) ob/+ [error rate (max. distance) = 8.3%] and (C) ob/ob mice [error rate (max. distance) = 38.8%]. In the sample scatter plots each dot/triangle represents a mouse. Mice can be discriminated according to treatment on component 1. Contribution level of the inflammatory and immune variables on component 1 for the (D) ob/+ and (E) ob/ob mice. The bar length represents the importance of the variable in the multivariate model. Bars are colored according to the experimental group with the maximal mean expression level. (F, G) Two-way ANOVA was used with genotype and indole treatment as fixed effects and the cage as random effect. Mean values were compared pairwise using the Tukey post-hoc test. Data are presented as means ± SEM, n ≥6/group. NS, not significant (P ≥ 0.05); *significantly different from control within a genotype (P < 0.05). ALAT, alanine aminotransferase; ASAT, aspartate aminotransferase; Ccl2, C-C motif chemokine ligand 2; Col1a1, collagen type I α 1 chain; Cxcl2, C-X-C motif chemokine ligand 2; Cyp1a1, cytochrome P450 family 1 subfamily A polypeptide 1 ; Cyp1b1, cytochrome P450 family 1 subfamily B polypeptide 1; Itgam, integrin subunit α M (Cd11b); Itgax, integrin subunit α X (Cd11c); ob/+ C, control ob/+ mice; ob/+ I, indole-treated ob/+ mice; ob/ob C, control ob/ob mice; ob/ob I, indole-treated ob/ob mice; PLS-DA, partial least squares discriminant analysis.

