Figure 1.

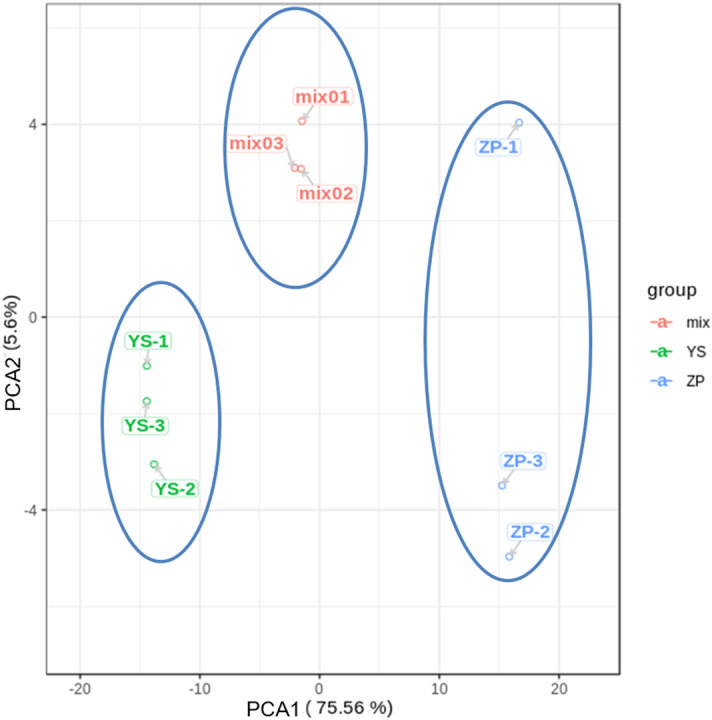
PCA score chart based on mass spectrum data of ZP, YS and QC samples. Ordinate: the second principal component, Abscissa: the first principal component. PCA Plot visualized in ggplot2 toolkit of R v3.5.0 (https://www.r-project.org/).

PCA score chart based on mass spectrum data of ZP, YS and QC samples. Ordinate: the second principal component, Abscissa: the first principal component. PCA Plot visualized in ggplot2 toolkit of R v3.5.0 (https://www.r-project.org/).