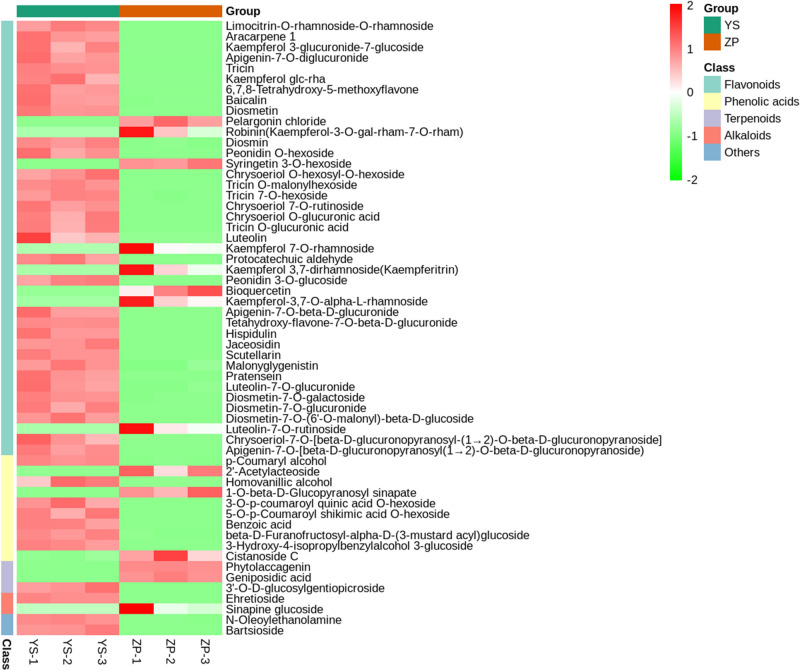
Figure 4.
Heat map of 58 DMs. Ordinate: clustering after normalization of relative contents of different metabolites, 5 kinds of colors stand for 5 classes of metabolites, Abscissa: grouping of samples, 2 kinds of colors stand for 2 groups of samples, Color scale from green to red indicated the contents of differentially expressed metabolites vary from low to high. Heatmap visualized in ggplot2 toolkit of R v1.0.12 (https://www.r-project.org/).

