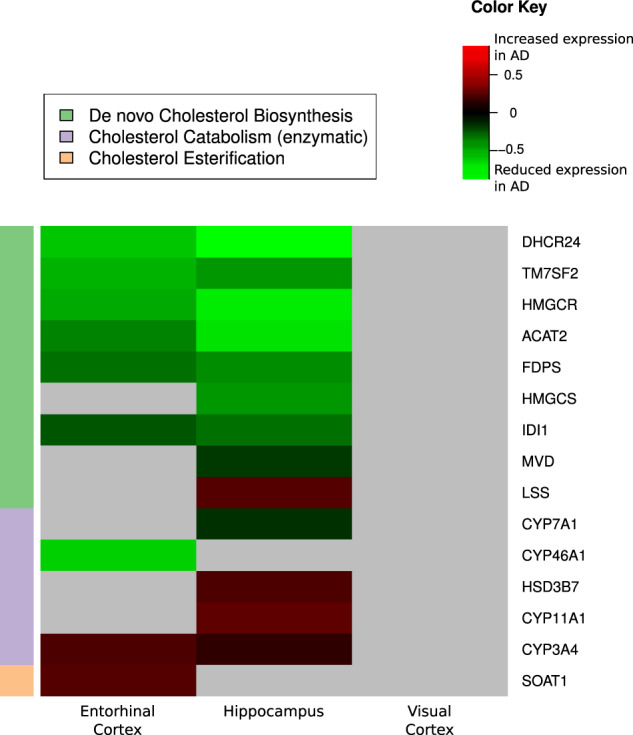
Fig. 1. Differential brain gene expression in AD.

AD Alzheimer’s disease, CN control, ERC entorhinal cortex. Differential brain gene expression of de novo cholesterol biosynthesis, catabolism (enzymatic), and esterification in AD. Summary of genes differentially expressed in selected brain regions in AD compared to CN across three pathways (de novo cholesterol biosynthesis, cholesterol catabolism (enzymatic), and cholesterol esterification). Green shading indicates that gene expression was significantly reduced in AD compared to CN. Red shading indicates that gene expression was significantly increased in AD compared to CN. Gray shading indicates gene expression was not significantly different between AD and CN. Gene Expression Ominbus (GEO) data sample size: ERC: AD (n = 25), CN (n = 52); hippocampus: AD (n = 29), CN (n = 56); visual cortex: AD (n = 18), CN (n = 12).
