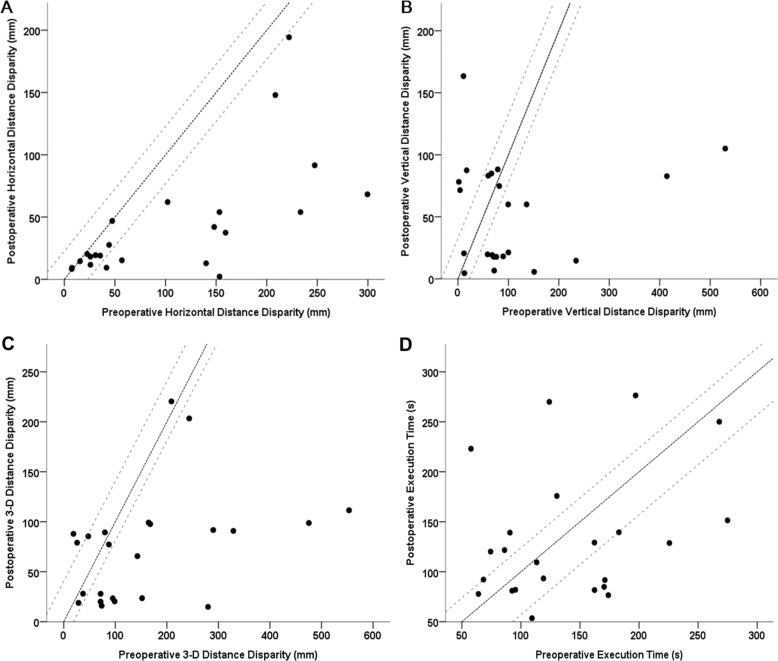
Fig. 3. Changes in the performance of block-building preoperatively vs post-operatively in the patients with intermittent exotropia.
Scatterplot representations for a horizontal, b vertical, and c 3-dimensional (3-D) distance disparities, and d execution time. The dashed lines on either side of the unity line indicate 95% confidence intervals for change (test–retest variability) from the normal controls. Datapoints falling above the dashed line represent a change in the performance that exceeded test–retest variability. s second.

