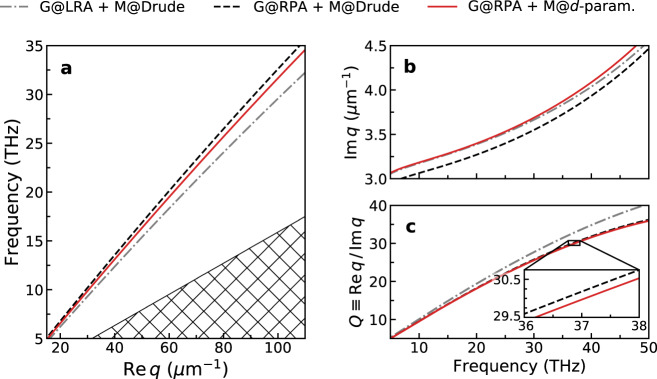
Fig. 2. Influence of metallic quantum surface-response on the dispersion of acoustic graphene plasmons (AGPs).
Three increasingly sophisticated tiers of response models are considered: (i) classical, local response for both the graphene and the metal [gray dot-dashed line]; (ii) nonlocal RPA and local Drude response for the graphene and the metal, respectively [black dashed line]; and (iii) nonlocal RPA and d-parameter-augmented response for the graphene and the metal, respectively [red solid line]. a AGP dispersion diagram, ω/(2π) versus . The hatched region indicates the graphene’s electron–hole continuum. b Associated imaginary part of the AGP wavevector, . c Corresponding quality factor . The inset shows a zoom of the indicated region. System parameters: we take a graphene–metal separation of t = 1 nm; for concreteness and simplicity, we consider an unscreened jellium metal with plasma frequency ωp ≈ 9.07 eV (corresponding to rs = 3) where ζ ≈ 0.8 Å and ξ ≈ 0.3 Å24, with Drude-type damping γm = 0.1 eV; for graphene, we take EF = 0.3 eV and γ = 8 meV; finally, we have assumed ϵd ≡ ϵ1 = ϵ2 = 1 (for consistency with the d-parameter data which assumes a metal–vacuum interface24).

