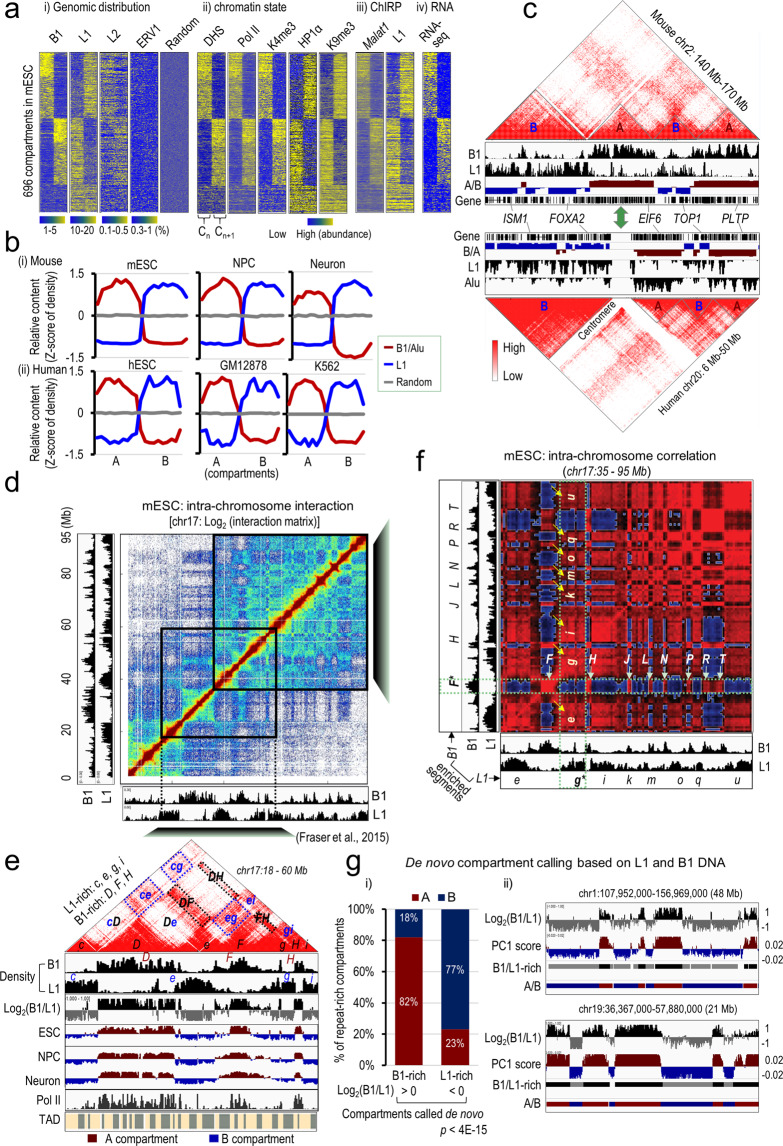
Fig. 1. B1- and L1-rich genomic regions homotypically interact, characterize and predict Hi-C compartments.
a Heatmaps of the distribution densities of B1, L1, L2, and ERV1 repeats and random genomic regions (panel (i)), DNase I hypersensitive sites (DHS) and ChIP-seq signals of Pol II, H3K4me3, HP1α, and H3K9me3 (panel (ii)), ChIRP-seq signals of Malat1 and L1 RNA (panel (iii)), and RNA-seq (panel (iv)) in mESCs across two adjacent compartments (Cn, Cn+1). All signals in 696 compartments annotated in mESCs were sorted according to the B1 distributions shown in panel (i). b Relative contents of L1 and B1/Alu repeats across the A and B compartments annotated in various cell types in mouse (top) and human (bottom). Random genomic regions serve as the negative control. c Genome browser shots showing conserved domain structures as indicated by heatmaps of the Hi-C contact matrix over a syntenic region in mouse (top) and human (bottom) ESCs. The B1/Alu and L1 repeat densities, the A/B compartments are shown by eigenvalues of the Hi-C contact matrix, and Refseq gene annotations are shown underneath each heatmap. d Heatmap of normalized interaction frequencies at 100-kb resolution on chromosome 17 in mESCs. Genomic distributions and densities of B1 and L1 repeats are shown in the left and bottom tracks. e A zoomed-in view of the interaction matrix of the genomic region from 18 to 60 Mb on mouse chr17 (40-kb resolution). Under the heatmap, we show sequentially genomic distributions and densities of B1 and L1 repeats (in 10-kb bin), log2 ratio of B1 to L1 density, eigenvalues of the Hi-C matrix representing A/B compartments from mouse mESCs, neural progenitor cells (NPC) and neurons, and Pol II ChIP-seq signals and annotated TADs in mESCs. B1-rich regions are arbitrarily labeled as D, F, and H in uppercase. L1-rich regions are labeled as c, e, g, and i in lowercase. Some strong homotypic interactions between compartments rich in the same repeat subfamily (for example, between the B1-rich regions DF, DE and FH, and between the L1-rich regions ce and cg), are highlighted by dotted boxes. f Correlation heatmap showing Pearsonʼs correlation coefficients of the interaction frequencies of any two paired regions in a sub-region on chr17 (500-kb resolution). B1-rich regions are labeled in uppercase as F, H … R, T. L1-rich regions are labeled in lowercase as e, g … q, u. Dotted boxes (in red) and arrows highlight positive correlations of the anchor region F (indicated by *) with other B1-rich genomic regions (horizontal), and of the anchor region g (indicated by *) with other L1-rich genomic regions (vertical). g De novo compartment calling based on L1 and B1 DNA sequences. Panel (i) shows the percentage of L1- or B1-rich compartments overlapped with A or B compartments identified by Hi-C. Panel (ii) shows representative genomic regions with ratio of B1 to L1 in log2 scale and PC1 score of Hi-C interaction matrix.

