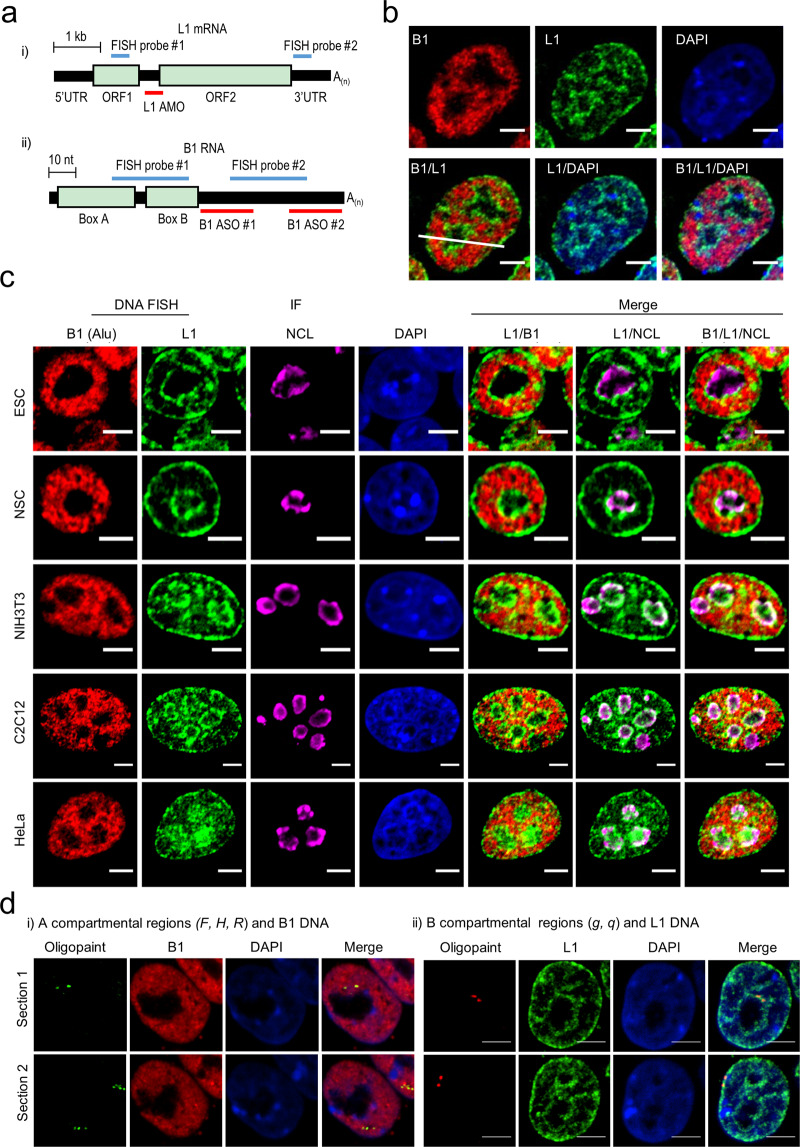
Fig. 2. DNA FISH reveals the spatial segregation of L1 and B1 compartments.
a Schematic illustrations of L1 (panel (i)) and B1 (panel (ii)) RNA targeted by AMO/ASO or DNA FISH probes. b Representative images of L1 (green) and B1 (red) repeats revealed by DNA FISH in mESCs. DNA is labeled by DAPI (blue). All scale bars, 5 μm. c Representative images of DNA immuno-FISH analysis of L1 (green) and B1 (red) DNA repeats, and NCL protein (purple) in mESCs (n = 37), NSC (n = 23), NIH3T3 (n = 18), C2C12 (n = 11) and HeLa cells (n = 15). d Representative images of Oligopaint DNA FISH of individual sites in A or B compartments. Panel (i), three A-compartmental regions (F, H, R) with B1 DNA FISH; panel (ii), two B-compartmental regions (g, q) with L1 DNA FISH. See also Supplementary information, Fig. S5.

