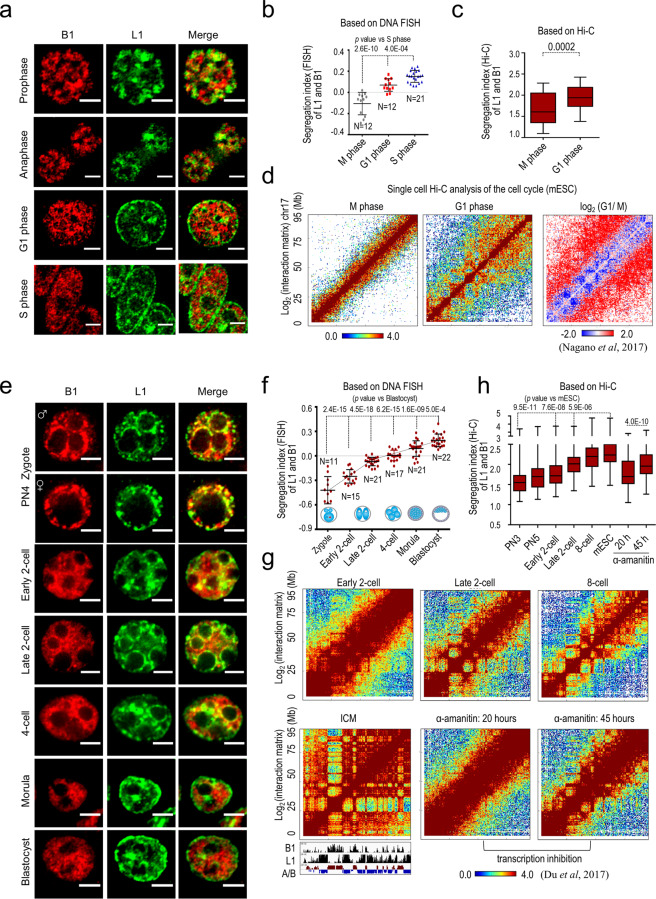
Fig. 3. Dynamic segregation of L1 and B1 compartments during the cell cycle and embryonic development.
a, b DNA FISH analysis of synchronized mESCs at different cell cycle stages. Representative images and the scatterplot of the segregation index of L1 and B1 DNA are shown in a and b, respectively. Data are presented as means ± standard deviation (SD). n, number of nuclei analyzed. M phase and G1 phase data are compared to S phase using the two-tailed Student’s t-test. P values are shown at the top. c Boxplot analysis of the ratio of homotypic interactions versus heterotypic interactions for B1 and L1 based on single-cell Hi-C data from mESCs. The y-axis shows the segregation index (Hi-C) of L1 and B1, which represents the ratio of average interaction frequency between compartments containing similar repeats (B1.B1 and L1.L1) to that between compartments containing different repeats (B1.L1) for all chromosomes (except X and Y). Larger values indicate a higher degree of homotypic interaction between B1- or L1-rich compartments. P values are calculated with the two-tailed Student’s t-test. d Heatmaps of normalized interaction frequencies at 500-kb resolution on chromosome 17 in mESCs at M (left) and G1 (middle) phase. A comparison of contact frequencies between M and G1 phase [log2(G1/M)] for the whole of chromosome 17 is shown on the right. e, f DNA FISH analysis of early embryos. Representative FISH images and the scatterplot of the segregation index of L1 and B1 DNA are shown in e and f, respectively. Data are presented as means ± SD (embryos were collected and processed in two independent experiments). n, number of nuclei analyzed. Each sample is compared to sample at the blastocyst stage and P values are calculated with the two-tailed Student’s t-test. Dotted lines show the trend-line. g Heatmaps of normalized interaction frequencies at 500-kb resolution on chromosome 17 in mouse embryos at the early 2-cell, late 2-cell, 8-cell, inner cell mass (ICM) stages and also in embryos treated with the transcription inhibitor α-amanitin for 20 and 45 h. Genomic densities of B1 and L1 repeats are shown at the bottom. h Boxplots showing the Hi-C segregation index of L1 and B1 in early embryos at various stages. The first six samples show a gradual increase of homotypic versus heterotypic interactions between L1-rich and B1-rich regions from zygotes (including PN3 and PN5 stages) to 8-cell embryos and pluripotent mESCs (in vitro equivalent of the inner cell mass cells of blastocysts). Each sample is compared to mESCs and P values are calculated with the two-tailed Student’s t-test. The last two samples show the segregation index for embryos treated with α-amanitin for 20 or 45 h. P values are calculated with two-tailed Student’s t-test.

