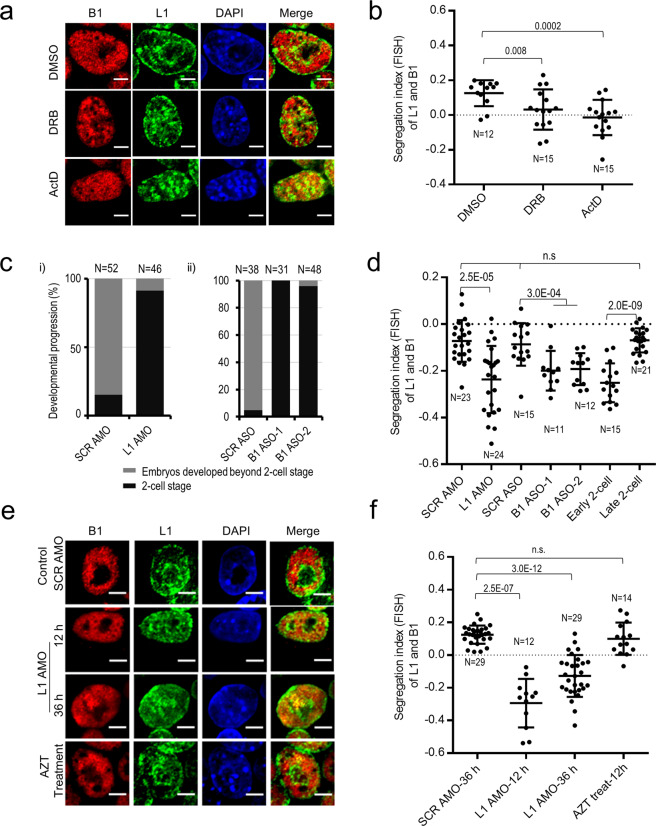
Fig. 4. Repeat RNA and transcription promote the spatial segregation of L1 and B1 compartments.
a, b DNA FISH analysis of L1 (green) and B1 (red) repeats in mESCs treated with transcription inhibitors for 3 h. Representative images and the scatterplot of the segregation index of L1 and B1 DNA are shown in a and b, respectively. DMSO, mock control; DRB (100 μM), a drug inhibits the release and elongation of Pol II; ActD (1 μg/mL), a drug inhibits both Pol I and II. Both drug treatments disrupt the perinucleolar staining of L1 DNA and induce mixing of the L1 and B1 DNA signals. Treatment with ActD elicits a stronger mixing effect than DRB. c Developmental analysis of embryos microinjected with scramble (SCR) or L1 AMO (panel (i)) or with SCR or two different B1 ASOs (ASO-1 and ASO-2) (panel (ii)) at the zygote stage. n, number of embryos analyzed. d Embryos depleted of L1 RNA by AMO or B1 RNA by ASO show poorer L1/B1 segregation, as indicated by significantly lower L1/B1 segregation indexes compared to the scramble AMO/ASO controls and noninjected late 2-cell embryos. Each dot represents an embryo analyzed. Data were collected from three independent experiments. P values are calculated with the two-tailed Student’s t-test. e, f DNA FISH analysis of L1 (green) and B1 (red) repeats in mESCs transfected with scramble AMO for 36 h, or L1 AMO for 12 and 36 h, or treated with the drug AZT for 12 h. Representative images and the scatterplot of the segregation index of L1 and B1 DNA are shown in e and f, respectively. All scale bars, 5 μm. n, number of nuclei analyzed. Data are presented as means ± SD (> 3 independent experiments, except two biological replicates for AZT treatment), and P values are calculated with two-tailed Student’s t-test.

