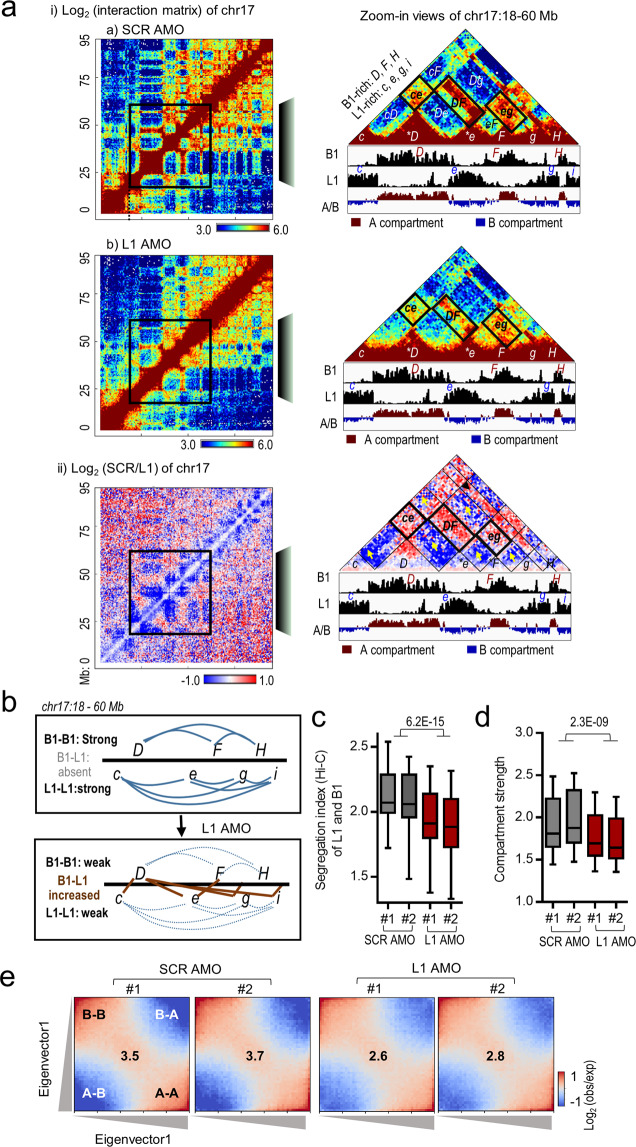
Fig. 5. L1 RNA is required for the formation and maintenance of higher-order chromatin structure.
a Hi-C analysis of mESCs treated with scramble control (SCR) or L1 AMOs for 36 h. Panel (i) shows Hi-C heatmaps of contact frequencies for SCR and L1 AMO, and panel (ii) shows the comparison of contact frequencies between SCR and L1 AMOs [log2(SCR/L1)]. The whole chromosome 17 (chr17) is shown on the left and the boxed sub-region (18–60 Mb) of chr17 is shown enlarged on the right (at 500-kb resolution). To better orient the visualization and comparison of these three sub-region heatmaps, representative homotypic interactions (ce, DF, and eg) are labeled with black boxes in the right panels. Relevant B1- and L1-rich compartments are labeled as in Fig. 1. b Schematic representation of compartmental interactions before and after depletion of L1 RNA based on Hi-C data shown in a. The control mESCs show strong homotypic interactions (indicated by blue solid lines), whereas L1-depleted cells show weakened homotypic interactions (dotted blue lines) and abnormal increases of heterotypic interactions (indicated by brown solid lines). c Boxplots of Hi-C-based segregation indexes. L1 AMO led to decreased ratios of homotypic interaction versus heterotypic interaction between L1-rich and B1-rich regions compared to SCR AMO. The P value was calculated by the two-tailed Student’s t-test. d, e Analysis of compartment strength showing decreased compartmentalization in mESCs treated with L1 AMOs for 36 h compared to SCR AMO. Boxplots of compartment strength (d) and saddle plots of Hi-C data binned at 100 kb resolution (e) are shown. The P value was calculated by the two-tailed Student’s t-test. Saddle plots were calculated using the Eigenvector1. The numbers at the center of the heatmaps indicate compartment strength calculated as the ratio of (A–A + B–B)/(A–B + B–A) using the mean values from the corners as indicated.

