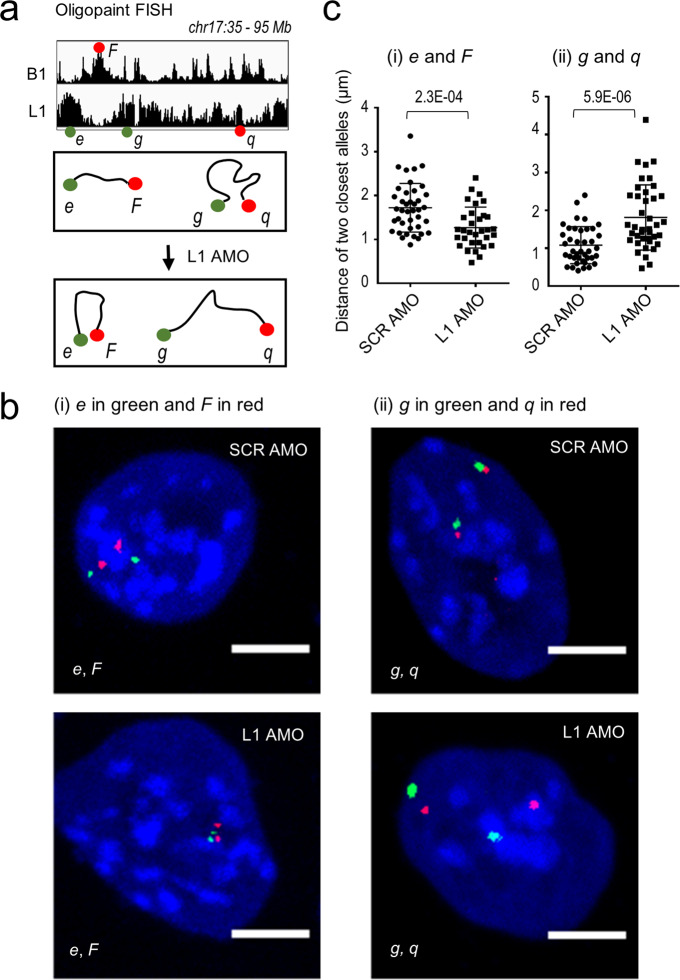
Fig. 6. Depletion of L1 RNA alters nuclear localizations of L1/B1-rich sequences.
Oligopaint DNA FISH analysis of four representative loci before and after depletion of L1 RNA for 36 h in mESCs. a Scheme of relative chromosomal localizations and spatial distances of the four compartments labeled by Oligopaint DNA FISH probes. B1-rich domain: F. L1-rich domains: e, g, and q. b, c Representative images and quantification of the spatial distances between two labeled compartments are shown in b and c, respectively. Each dot in c represents a nucleus. In cells treated with L1 AMO, the median distance between the two B1 and L1 compartments e and F is significantly decreased compared to the control, while the median distance between the two L1 compartments g and q is significantly increased. Data are presented as means ± SD. n, number of nuclei analyzed. P values are calculated by the two-tailed Student’s t-test. Scale bars, 5 μm.

