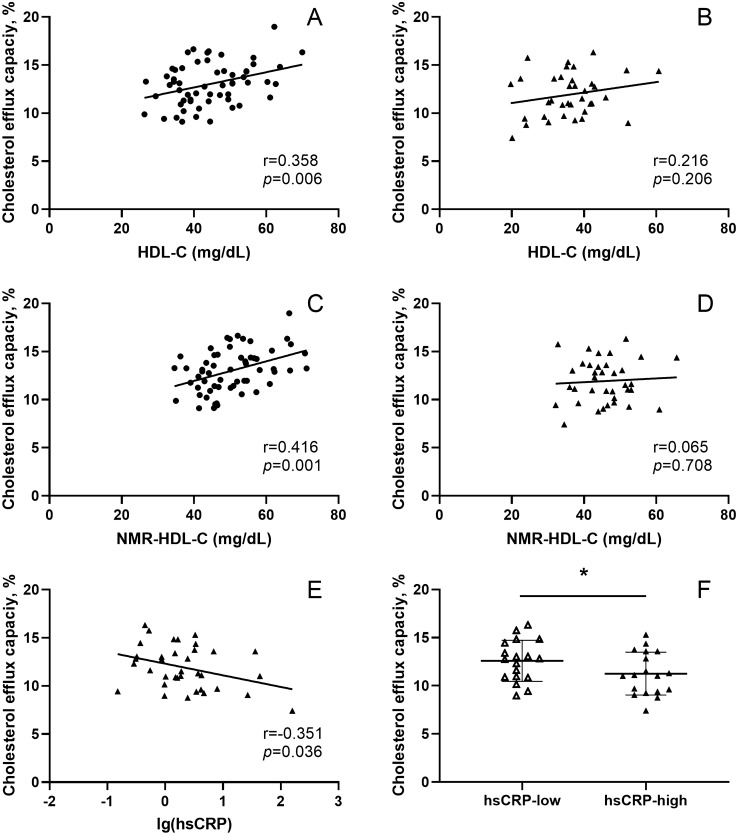
Figure 2.
Correlation between CEC and HDL-C in (A) non-CAD controls and (B) CAD patients. Correlation between CEC and NMR-HDL-C in (C) non-CAD controls and (D) CAD patients. (E) Correlation between hsCRP levels (log-transformed) and CEC in CAD patients (n = 36); (F) Comparison of CEC between hsCRP-low CAD patients (hsCRP < 1.75 mg/L, n = 18) and hsCRP-high CAD patients (hsCRP ≥ 1.75 mg/L, n = 18). CEC, cholesterol efflux capacity; CAD, coronary artery disease; NMR-HDL-C, NMR measured high-density lipoprotein cholesterol; hsCRP, high-sensitivity C-reactive protein; CEC, cholesterol efflux capacity; CAD, coronary artery disease; * p < 0.05. Statistical analysis was performed using SPSS version 25.0 (IBM, USA, https://www.ibm.com/analytics/spss-statistics-software) and the figure was made by GraphPad Prism version 8.0 (GraphPad Prism Inc, USA, https://www.graphpad.com/scientific-software/prism/).

