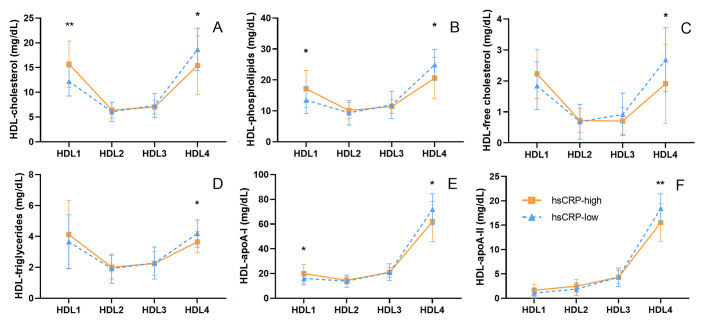
Figure 3.
Comparison of 24 HDL-subclass related lipoproteins between hsCRP-low CAD patients (hsCRP < 1.75 mg/L, n = 18) and hsCRP-high CAD patients (hsCRP ≥ 1.75 mg/L, n = 18). HDL subclasses were labeled numerically according to decreasing size and increasing density. HDL, high-density lipoprotein; apoA-I, apolipoprotein A-I; apoA-II, apolipoprotein A-II. Data have been expressed as mean ± SD; *p < 0.05, **p < 0.01. Statistical analysis was performed using SPSS version 25.0 (IBM, USA, https://www.ibm.com/analytics/spss-statistics-software) and the figure was made by GraphPad Prism version 8.0 (GraphPad Prism Inc, USA, https://www.graphpad.com/scientific-software/prism/).

