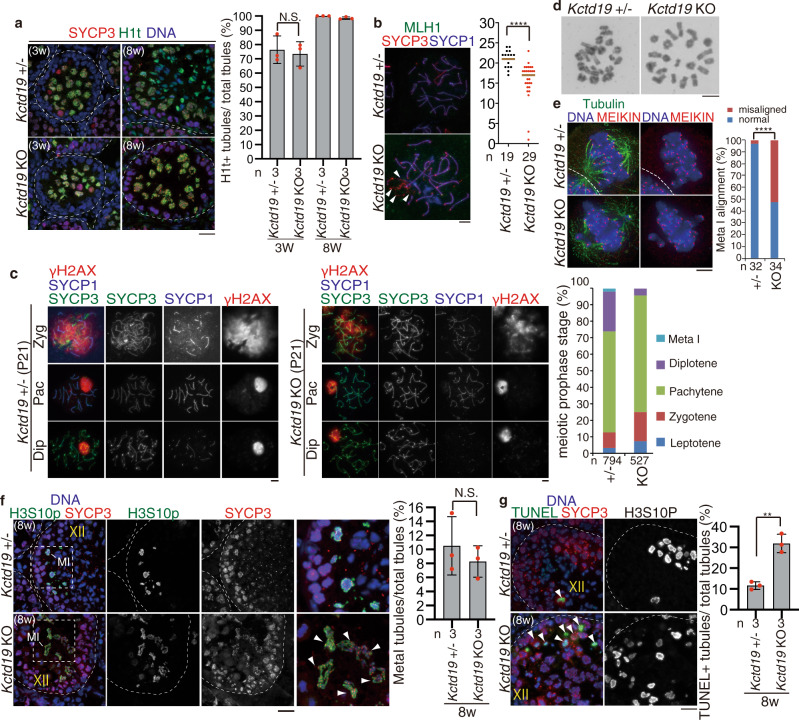
Fig. 6. Kctd19 knockout spermatocytes fail to complete meiosis I.
a Seminiferous tubule sections (3-weeks and 8-weeks old) were immunostained as indicated. Shown on the right is the quantification of the seminiferous tubules that have H1t+/SYCP3+ cells per the seminiferous tubules that have SYCP3+ spermatocyte cells in Kctd19± and Kctd19 KO mice (mean with SD). n: the number of animals examined for each genotype. Statistical significance is shown (two-tailed t-test). N.S.: statistically not significant. Scale bar: 25 μm. b Chromosome spreads of Kctd19± and Kctd19 KO spermatocytes were immunostained as indicated. The number of MLH1 foci is shown in the scatter plot with median (right). Statistical significance is shown by p-value (two-tailed Mann–Whitney U-test). ****p < 0.0001. n: number of spermatocytes examined. Asynapsed chromosomes in MLH1+ pachytene spermatocytes are indicated by white arrowheads. Scale bar: 5 μm. c Chromosome spreads of Kctd19± and Kctd19 KO spermatocytes at P21 were immunostained as indicated. Zyg: zygotene, Pac: pachytene, Dip: diplotene. Quantification of meiotic prophase stage per total SYCP3+ spermatocytes of Kctd19± and Kctd19 KO mice is shown on the right. n: the number of cells examined. Scale bar: 5 μm. d Giemza staining of metaphase I chromosomes from Kctd19± and Kctd19 KO spermatocytes. Independent Metaphase I cells (at least N = 19) for each genotype were examined in a single experiment. Scale bar: 5 μm. e Immunostaining of squashed metaphase I spermatocytes from Kctd19± and Kctd19 KO. The metaphase I kinetochores were identified by MEIKIN immunostaining. Quantification of metaphase I spermatocytes with chromosome misalignment is shown on the right. n: the number of spermatocytes examined. Statistical significance is shown by ****p = 2.65 × 10⁻¹⁰ (chi-square test). Scale bar: 5 μm. f Seminiferous tubule sections (8-weeks old) were stained for SYCP3, H3S10p, and DAPI. M I: Metaphase I spermatocyte. Enlarged images are shown on the rightmost panels. Arrowheads indicate misaligned chromosomes. Shown on the right is the quantification of the seminiferous tubules that have H3S10p+/SYCP3+ Metaphase I cells per the seminiferous tubules that have SYCP3+ spermatocyte cells in Kctd19± and Kctd19 KO testes (mean with SD). n: the number of animals examined for each genotype. Statistical significance is shown by p-value (two-tailed t-test). N.S.: Statistically not significant. Scale bar: 25 μm. g Seminiferous tubule sections from 8-weeks old mice were subjected to TUNEL assay with immunostaining for SYCP3 and H3S10p. Arrowheads indicate TUNEL-positive cells. Shown on the right is the quantification of the seminiferous tubules that have TUNEL+ cells per total tubules in Kctd19± and Kctd19 KO testes (mean with SD). Statistical significance is shown by **p = 0.0019 (two-tailed t-test). Scale bar: 25 μm. Boundaries of the seminiferous tubules are indicated by white dashed lines.

