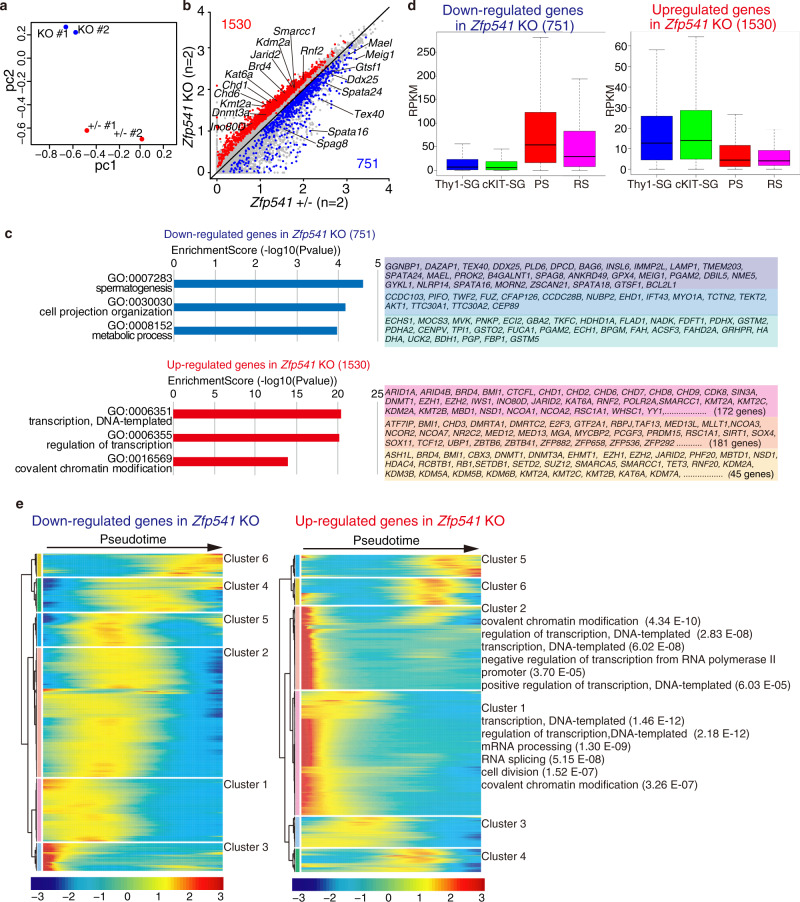
Fig. 7. Transcriptome analysis of meiotic prophase spermatocytes in Zfp541 KO.
a The GFP-positive cells were isolated from control Zfp541± and Zfp541 KO testes (P18) on the Rec8-3FH-p2A-GFP KI background by fluorescent sorting. Principal component analysis of the transcriptomes of GFP-expressing cells (meiotic prophase spermatocytes) in Zfp541± and Zfp541 KO on the Stra8-3FH-p2A-GFP KI background is shown. b Scatter plot of the transcriptome of GFP-expressing cells in Zfp541± (n = 2) versus Zfp541 KO (n = 2) is shown. The numbers of differentially expressed genes are shown. Significance criteria: false discovery rate ≤ 0.05. c GO analysis of the downregulated genes (upper) and upregulated genes (lower) in GFP-expressing cells of Zfp541 KO testes. See Supplementary Data 1 for a complete gene list of the GO analyses. d Expression levels (RPKM) of the downregulated 751 genes (left) and the upregulated 1530 genes (right) in GFP-expressing spermatocytes of Zfp541 KO are shown by box-whisker plot (whiskers indicate min and max. Bounds of box indicate 25th and 75th percentiles quantile with median). The upregulated and downregulated genes in Zfp541 KO were reanalyzed with the previous y published data of stage-specific bulk RNA-seq (N = 2 biologically independent samples)22,24. Thy-SG: Thy+ spermatogonia, cKIT-SG: cKIT+ spermatogonia, PS: pachytene spermatocytes, RS: round spermatid. e Heatmaps showing the hierarchical relationship among the clusters of DEGs across pseudotime of spermatogenesis. Expressions of the downregulated genes (left) and the upregulated genes (right) in GFP-expressing spermatocytes of Zfp541 KO was assessed by reanalyzing scRNA-seq data of spermatogenic cells (GEO: GSE109033)29. Pseudotime (left to right) corresponds to the developmental trajectory of spermatogenesis (undifferentiated spermatogonia to round spermatids). In clusters 1 and 2 of upregulated genes, GO terms (top 5 by p-value) with false discovery rate (FDR) < 0.01 are shown. In other clusters, GO-term is not shown due to statistically higher FDR. See Supplementary Data 2 for the complete gene list of the GO analyses.

