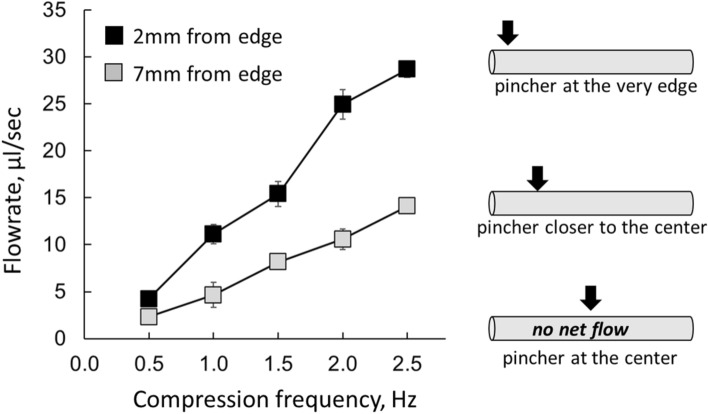
Figure 4.
The flowrate–pincher position relationship. For all tested conduits, the maximal flow rates were observed when the pincher was at the very edge (i.e., the position closest to the junction between the compliant tube and the connector). No net flow was observed when pincher was located in the middle of the tube. The values shown in this graph were acquired using a 27-mm-long, 5-mm-wide compliant segment with a wall thickness of 0.4 mm with the loop filled with aqueous solution. The data shown are for the two pincher positions—2 mm and 7 mm from the junction between the stiff and compliant segments.

