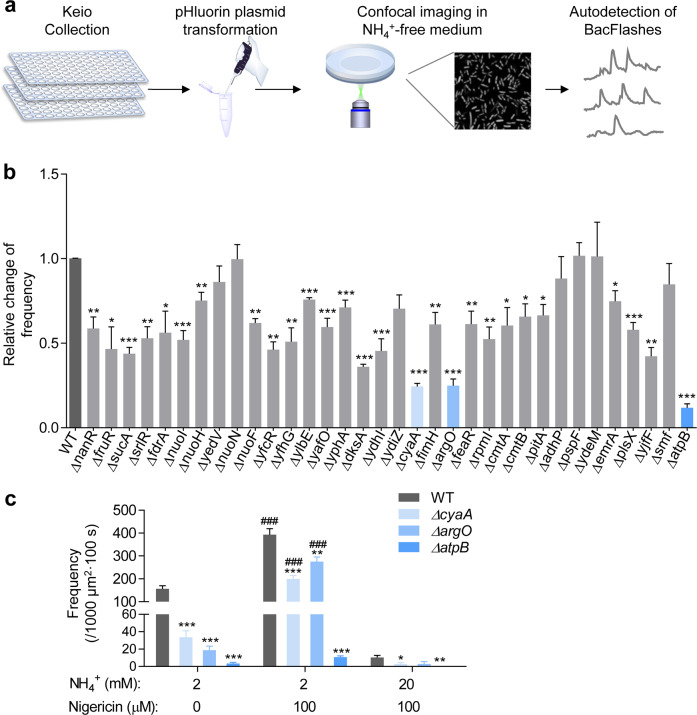
Fig. 3. Identification of putative proton sensor atpB for BacFlash ignition.
a Schematic diagram for whole-genome screening of BacFlash regulators in the Keio collection of BW25113 knockouts. See Materials and methods for details. b Relative BacFlash frequencies in different mutants from the third round of screening. The frequency in each mutant was normalized to WT frequency. Data are means ± SEM. n = 3–16 image stacks per group. *P < 0.05, **P < 0.01, ***P < 0.001 vs WT. c Loss of BacFlash response to nigericin (100 μM) in atpB-knockout mutant. Data are means ± SEM. n = 4–12 image stacks per group. *P < 0.05, **P < 0.01, ***P < 0.001 vs WT group under the same conditions. ###P < 0.001 vs 0 μM nigericin group in the same E. coli strain.

