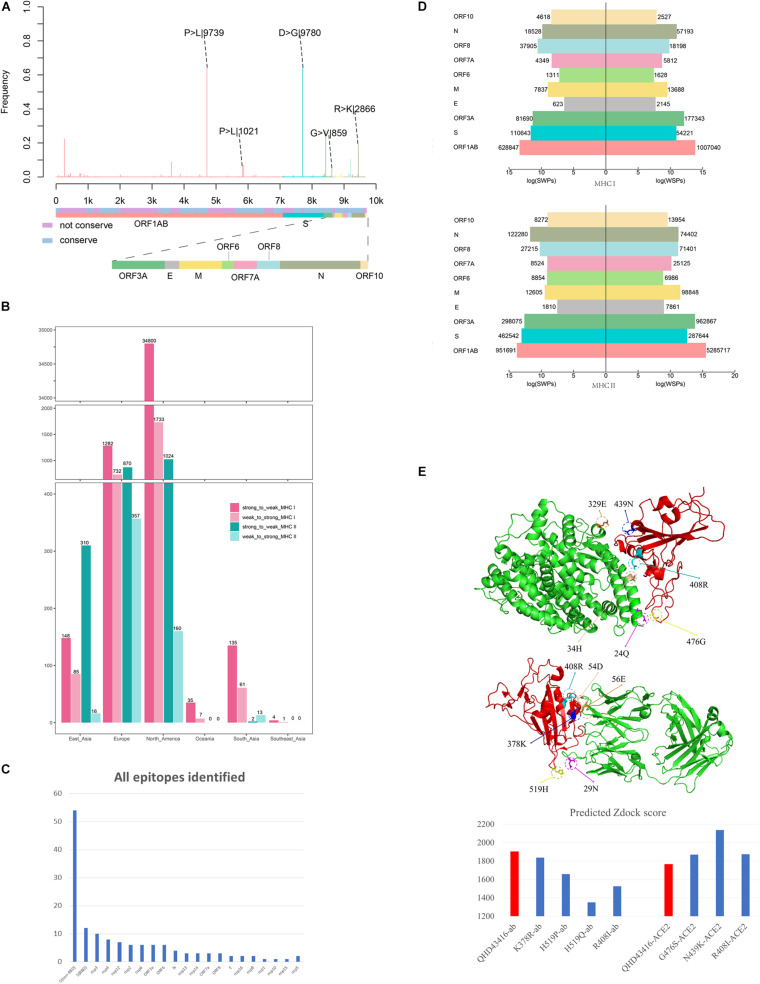
FIGURE 2.
Mutation profile and potential selective pressure analysis of SARS-CoV-2. (A) Mutation patterns on the whole genome of SARS-CoV-2. The bar plot shows the frequency of every site in the genome sequence, as different colors representing different structures of the genome sequence. (B) Number of SWPs and WSPs on the whole genome of SARS-CoV-2. The bar plot shows number of SWPs and WSPs in different structures of the sequence. SWPs represents strong to weak peptides; WSPs represents weak to strong peptides. (C) Number of all epitopes identified in Matenus’s work. The bar plot shows the number of all epitopes identified in Matenus’s work. ORF1ab is cleaved into many nonstructural proteins (NSP1-NSP16). S(RBD) represents receptor-binding domain in spike protein; S(non-RBD) represents the non-RBD portion of spike. N:nucleocapsid protein; E:envelope protein; ORF: open reading frame; (D) Number of cross-reactive SWPs and WSPs on ORF1ab. The bar plot shows number of CREs for HLA-I and HLA-II on all 6 continents including North America, Europe, South Asia, East Asia, Southeast Asia, and Oceania. CREs: cross-reactive epitopes. HLA:human leukocyte antigen (E) Impact of binding affinity for mutations on the S protein. The plot in left shows the 3-D structure changes in the mutation sites, and the bar plot in the right shows predicted Zdock score of the mutation site between RBD and ACE2.

