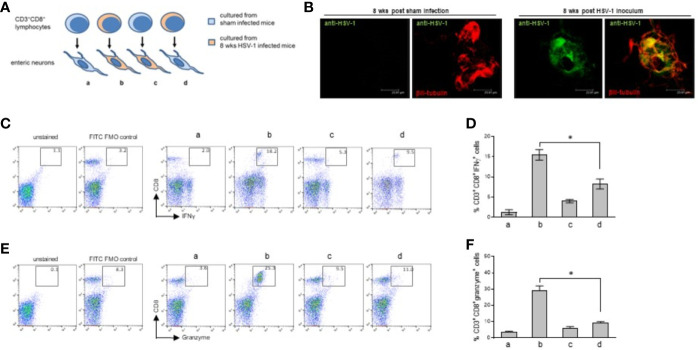
Figure 8.
Immune interaction between infiltrating CD3+CD8+ lymphocytes and enteric neurons. (A) Experimental design: enteric neurons were isolated from sham or 8 weeks HSV-1 infected mice and cultured. Cells were co-incubated with CD3+CD8+ lymphocytes purified by immune sorting from cell suspensions obtained from the LMMP of the sham or HSV-1 infected mice. T cells isolated from sham infected mice were co-incubated with the enteric neurons cultured from sham (a) or HSV-1 infected (c) mice. T cells isolated from HSV-1 infected mice were co-incubated with enteric neurons cultured from the sham (d) or HSV-1 infected (b) mice. Twenty-four hours later, the lymphocytes were collected, labeled with anti-CD3, anti-CD8, anti-IFNγ, and anti-Granzyme antibodies, and analyzed by flow cytometry. (B) Enteric neurons isolated from the LMMP of sham or HSV-1 infected mice were cultured in the presence of acyclovir (100 μM) for nine days (see Figure S5 ). Acyclovir was removed and cells were cultured for additional 24 hours. Cells were then fixed and immunofluorescence for pan HSV-1 antigens (green) and βIII-tubulin (red) was performed. Representative images of 24 independent experiments; n=1 mouse per experimental group. Three independent fields per animal were examined. Scale bars: 23.81 µm. (C, E) T cells co-cultured with neurons were stained as described above and analyzed by flow cytometry. The gating strategy is the same described in Figure S3 . CD8+IFNγ+ (C) and CD8+granzyme+ (E) cells (50,000 events) were analyzed in CD3+ cells. The experimental groups are denoted as a, b, c, d, as explained in (A). Representative dot plots of 6 independent experiments; n=1 mouse per experimental group. Unstained control and FITC (IFNγ or granzyme) FMO control are also reported. (D, F) Data from all the experiments were graphed. Data report the percentage (mean±SEM) of (D) CD8+IFNγ+ cells in CD3+ gated cells and (F) CD8+Granzyme+ cells in CD3+ gated cells. The experimental groups in histograms are denoted as a, b, c, d, as explained in (A). Experiments were repeated 6 times; n=1 mouse per experimental group. * denotes p < 0.05 vs (C, D).

