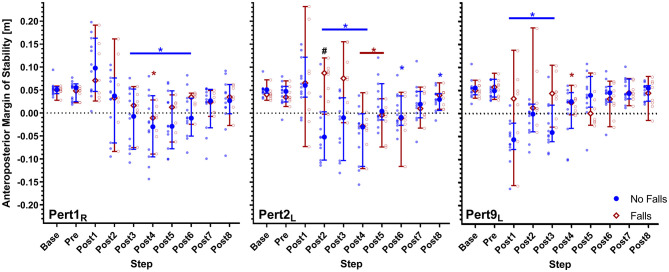
Figure 2.
Median and 95% confidence intervals (with individual data points) of the anteroposterior margins of stability during the first, second and ninth perturbations (Pert1R, Pert2L, and Pert9L, respectively) including unperturbed walking prior to each perturbation (Base), the final step prior to each perturbation (Pre) and the first eight recovery steps following the perturbations (Post1–8) for Falls and No-Falls groups. Blue * and Red *: significant difference to Base for the No Falls and Falls groups, respectively (P < 0.05; adjusted using Dunnett's multiple comparisons test). #Significant difference between the No Falls and Falls groups (P < 0.05; adjusted using Sidak's multiple comparisons test).

