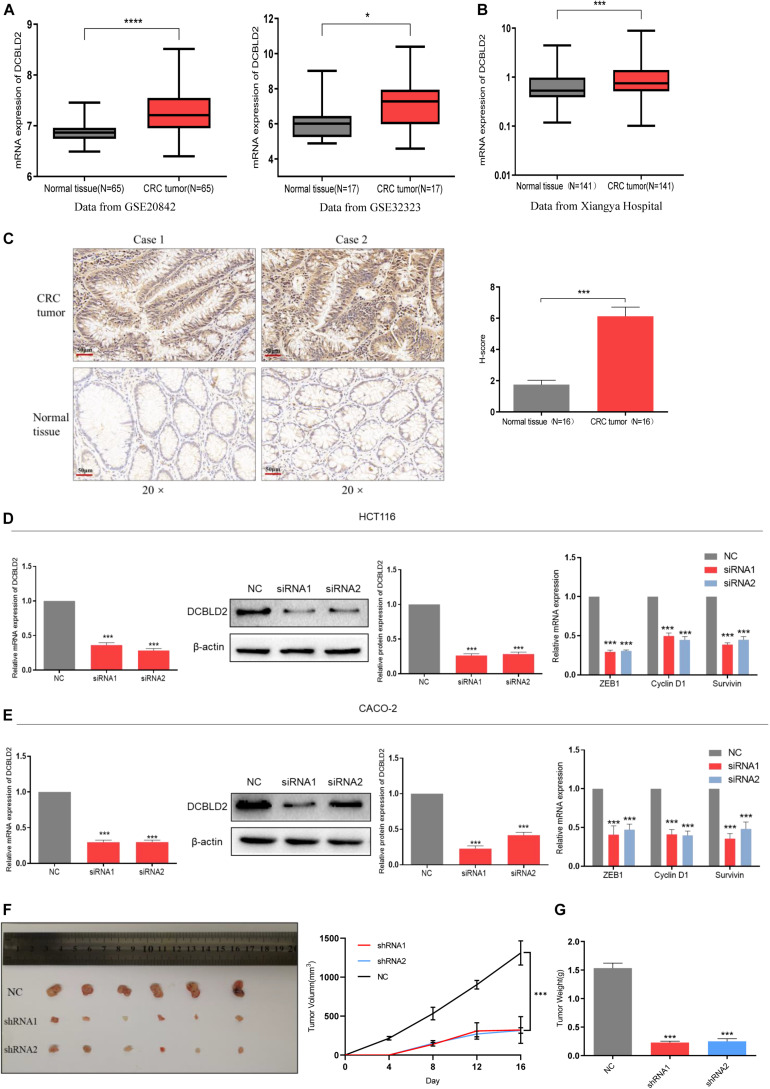
FIGURE 2.
DCBLD2 expression is up-regulated and leads to poor prognosis in CRC. (A) The difference of DCBLD2 expression between cancer and normal tissues in the data sets GSE20842 (****p < 0.0001) and GSE32323 (*p < 0.05). (B) The difference of DCBLD2 mRNA level between cancer and normal tissues in the samples from Xiangya Hospital (N = 141, ***p < 0.001). (C) The difference of DCBLD2 protein level between cancer and normal tissues in the samples from Xiangya Hospital. The picture on the right shows the quantitative statistics of the differences in protein expression (N = 16, ***p < 0.001). (D,E) After transfection of siRNA in HCT116 (D) and CACO-2 (E), the knockdown efficiency of DCBLD2 was tested by q-PCR experiment (***p < 0.001) and Western Blot experiment (***p < 0.001). The right figure shows the effect of down-regulation of DCBLD2 on the mRNA levels of tumor prognosis-related genes ZEB1, Cyclin D1 and Survivin (***p < 0.001; n = 3, Mann–Whitney test). (F,G) Tumor formation experiment in nude mice. Subcutaneous injection of HCT116/shDCBLD2 or HCT116/NC in 4-week-old male nude BALB/C mice (107 cells per mice). Taking out the tumor and take pictures after 16 days. (F) Tumor volumes after DCBLD2 shRNA1/2 adenovirus treatment (***p < 0.001; 6 mice per group). tumor length (L) and width (W) were measured every 4 days. Tumor volumes were calculated by the following formula: V = 0.5 × LW2. (G) Tumor weights in mice after DCBLD2 shRNA1/2 adenovirus treatment (***p < 0.001; 6 mice per group).

