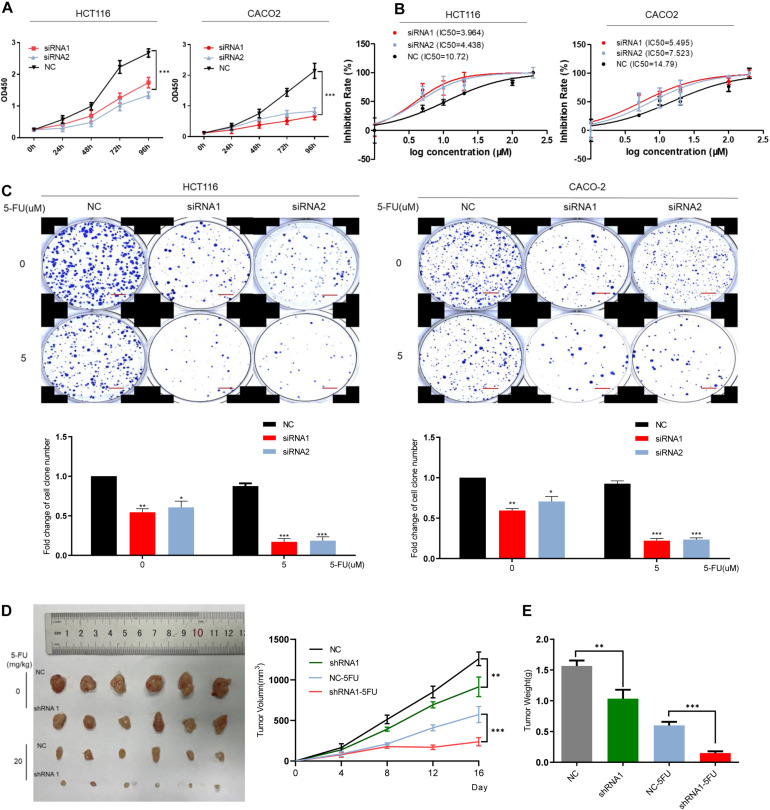
FIGURE 3.
DCBLD2 regulates the sensitivity of CRC cells and mice to 5-FU. (A) The effect of DCBLD2 on CRC cell proliferation. After transfection of siRNA in HCT116 and CACO-2 cells, OD450 was measured every 24 h (***p < 0.001; n = 3, Mann–Whitney test). (B) Changes in the sensitivity of CRC cells to 5-FU treatment after down-regulation of DCBLD2. Statistical chart showed IC50 dose of 5-FU calculated from measurement of cell viability in different concentrations of 5-FU. (C) Representative images of colony formation of transfected CRC cells after 5-FU treatment. The figure below shows the quantitative statistics of the number of cell clones. Scale bars: 0.1 mm (*p < 0.05, **p < 0.01, ***p < 0.001; n = 3, Mann–Whitney test). (D,E) The effect of DCBLD2 on tumor formation ability and drug sensitivity of mice. Four-week-old male nude BALB/C mice were subcutaneously injected with HCT116/shDCBLD2 or control cells (5 × 10⁶ cells per mice). When tumor volumes reached approximately 0.2 cm3, mice were subcutaneously injected with control vehicle (DMSO) or 5-FU (20 mg/kg every week). Taking out the tumor and take pictures after 16 days. (D) Tumor volumes after DCBLD2 shRNA1/2 adenovirus and 5-FU treatment (**p < 0.01; ***p < 0.001; 5 mice per group). tumor length (L) and width (W) were measured every 4 days. Tumor volumes were calculated by the following formula: V = 0.5 × LW2. (E) Tumor weights in mice after DCBLD2 shRNA1/2 adenovirus and 5-FU treatment (**p < 0.01; ***p < 0.001; 5 mice per group).

