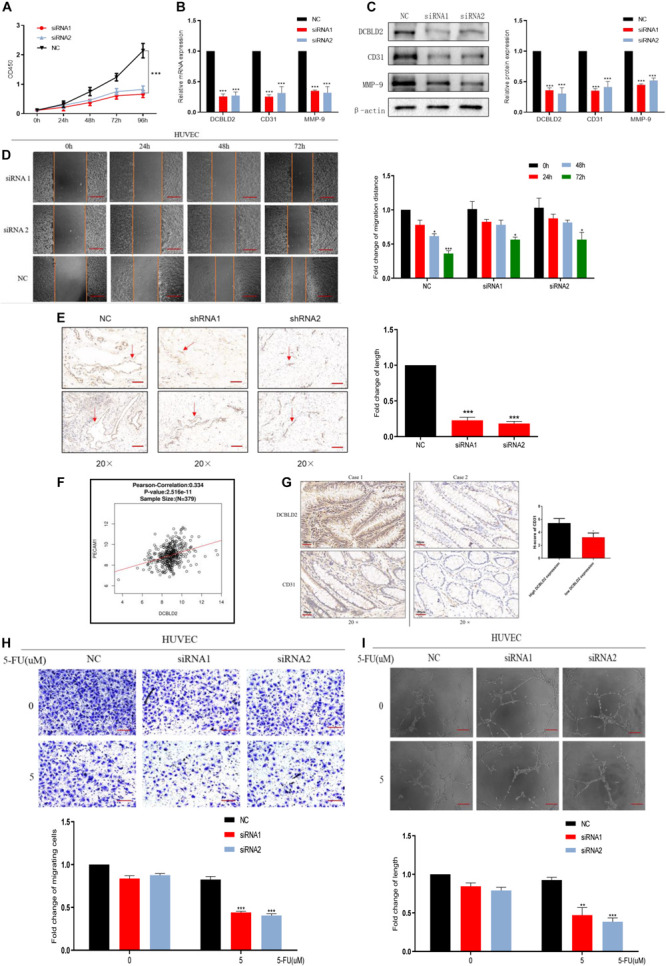
FIGURE 5.

Down-regulation of DCBLD2 can suppress angiogenesis. (A–D) CCK-8 proliferation assays (A), q-PCR assays (B), Western Blot assays (C) and Scratch assay (D) performed in HUVEC cells transfected with DCBLD2 siRNA1/2. Scale bars: 0.1 mm (*p < 0.05, **p < 0.01, ***p < 0.001; n = 3, Mann–Whitney test). (E) Matrigel plug assay performed in mice, 7 days later, the Matrigel plugs was taken out from the mouse skin, and an immunohistochemical experiment was performed to analyze the angiogenesis ability. Arrows indicate the formation of microvessels in Matrigel. Scale bars: 0.02 mm (***p < 0.001; 5 mice per group). (F) Immunohistochemistry experiment to study the correlation between CD31 and DCBLD2 expression at the protein level among the tumor tissues of 16 CRC patients collected in Xiangya Hospital. Case 1 correspond to high DCBLD2 and case 2 to low DCBLD2 (*p < 0.05, n = 16). (G) Analyze the correlation between the expression of CD31 and DCBLD2 at the mRNA level in the TCGA data (p < 0.05, n = 379). (H,I) After 5-FU treatment (5 μM), perform Transwell Matrigel migration experiment and angiogenesis experiment in HUVEC cells transfected with control siRNA or DCBLD2 siRNA1/2. Scale bars: 0.02 mm (**p < 0.01, ***p < 0.001; n = 3, Mann–Whitney test).
