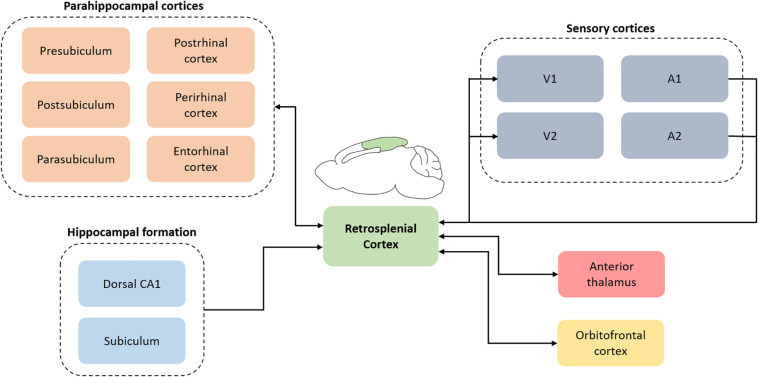
FIGURE 2.
A simplified schematic depicting retrosplenial connections with cortical and subcortical regions. The connectomic diagram is centered around retrosplenial cortex and does not include the complex interactions between all regions. V1, primary visual cortex; V2, secondary visual cortex; A1, primary auditory cortex; A2, secondary auditory cortex.

