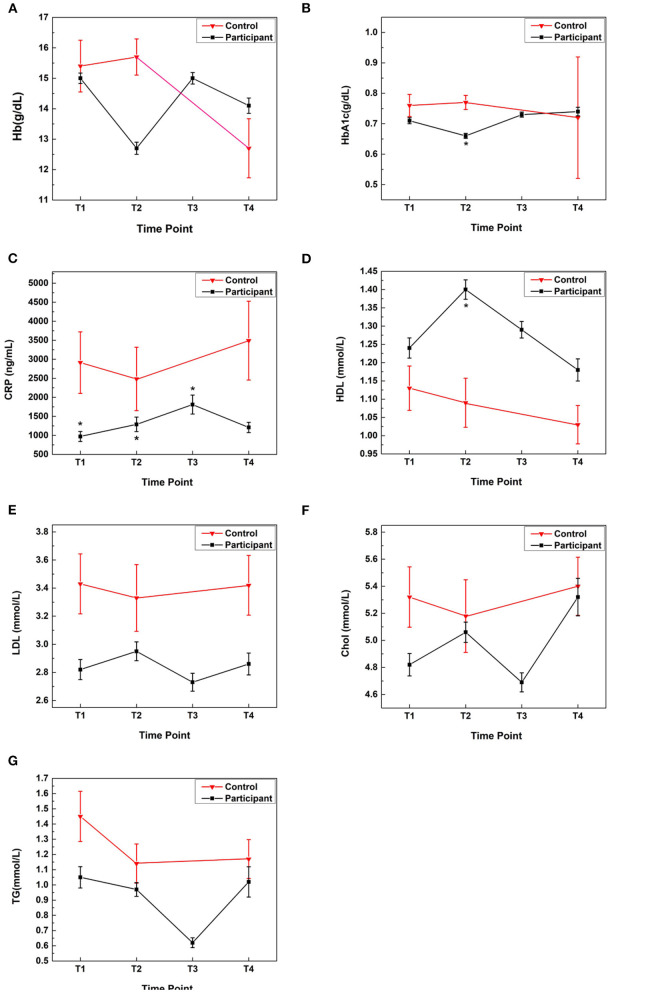
Figure 5.
Comparisons of blood biomarkers in Samyama participants and controls: blood biomarker data was analyzed for four timepoints (T1 = baseline; T2 = immediately before retreat; T3 = immediately after retreat; T4 = 3 months after retreat). Biomarkers measured were: (A) Hemoglobin, (B) HbA1c, (C) CRP, (D) HDL, (E) LDL, (F) Cholesterol, and (G) Triglycerides. Compared with the controls, the participants had 2–3-fold lower CRP levels at all timepoints (adjusted P < 0.02). At T2, participants had significantly improved HbA1c (0.66 g/dL, adjusted P = 0.002) and HDL (1.4 mmol/L, adjusted P = 0.02) compared with controls (0.77 g/dL and 1.09 mmol/L, respectively). * Denotes statistical significance comparing participants vs. controls at a given timepoint. An adjusted P < 0.05 was considered significant. Chol, cholesterol; CRP, C-reactive protein; Hb, hemoglobin; HbA1c, hemoglobin A1c; HDL, high-density lipoprotein; LDL, low-density lipoprotein; TG, triglycerides.

